. 2011 Apr;31(4):851-60.
doi: 10.1161/ATVBAHA.110.221952. Epub 2011 Jan 13.

Epigenetic regulation of vascular smooth muscle cell proliferation and neointima formation by histone deacetylase inhibition

Affiliations

Epigenetic regulation of vascular smooth muscle cell proliferation and neointima formation by histone deacetylase inhibition

Hannes M Findeisen et al. Arterioscler Thromb Vasc Biol. 2011 Apr.

Abstract

Objective: Proliferation of smooth muscle cells (SMC) in response to vascular injury is central to neointimal vascular remodeling. There is accumulating evidence that histone acetylation constitutes a major epigenetic modification for the transcriptional control of proliferative gene expression; however, the physiological role of histone acetylation for proliferative vascular disease remains elusive.

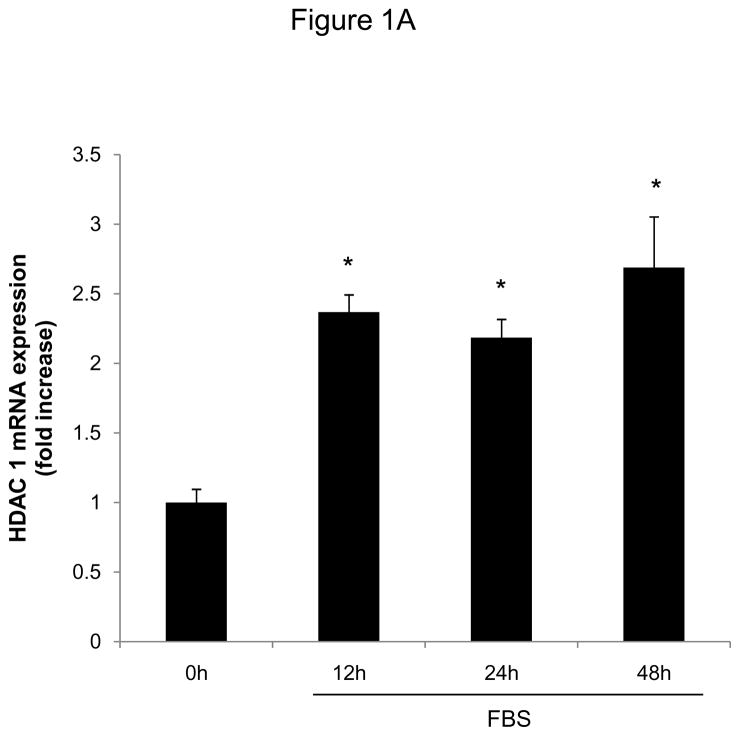
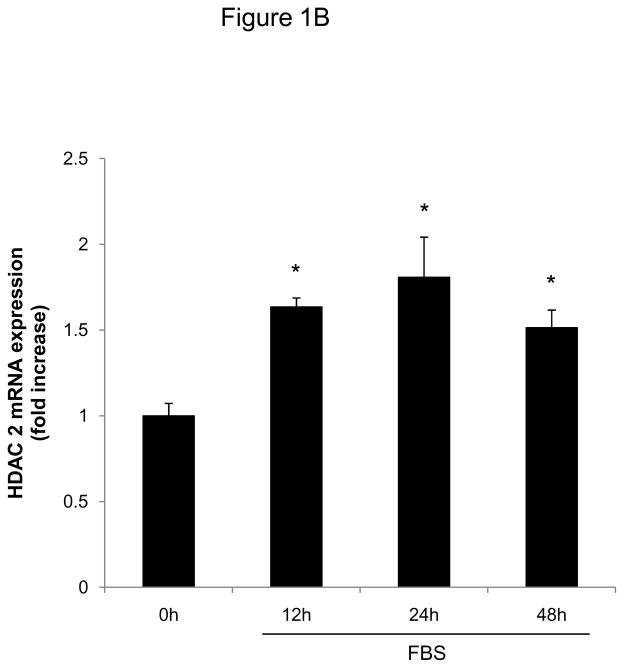
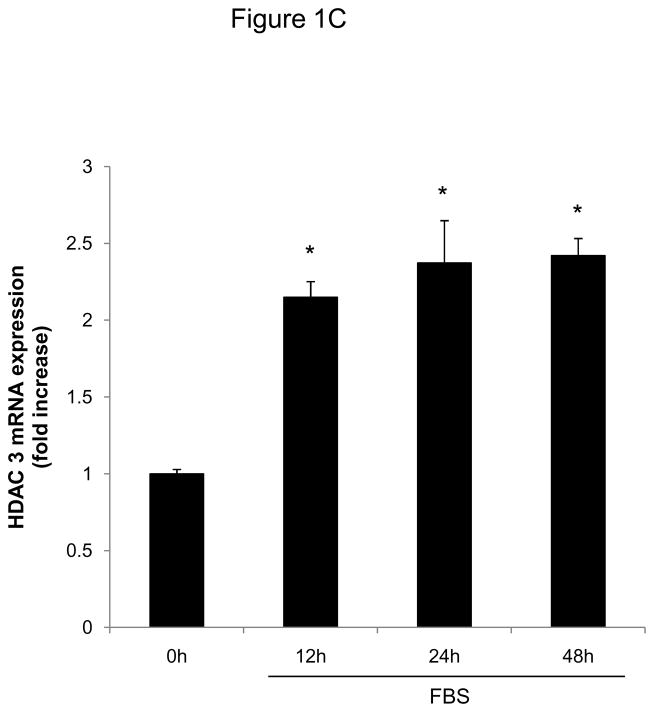
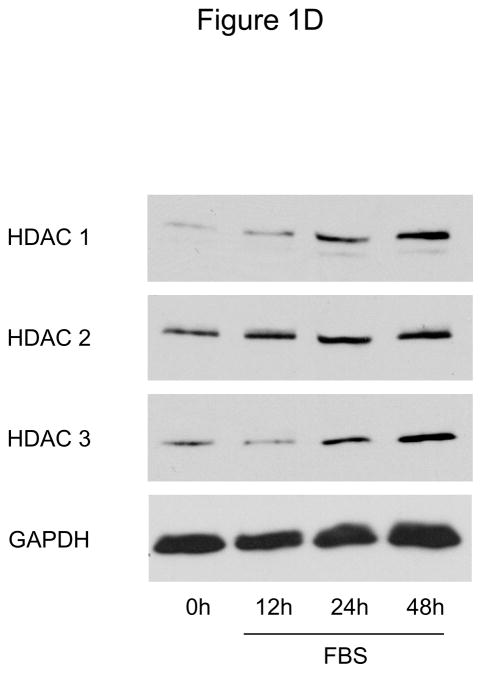
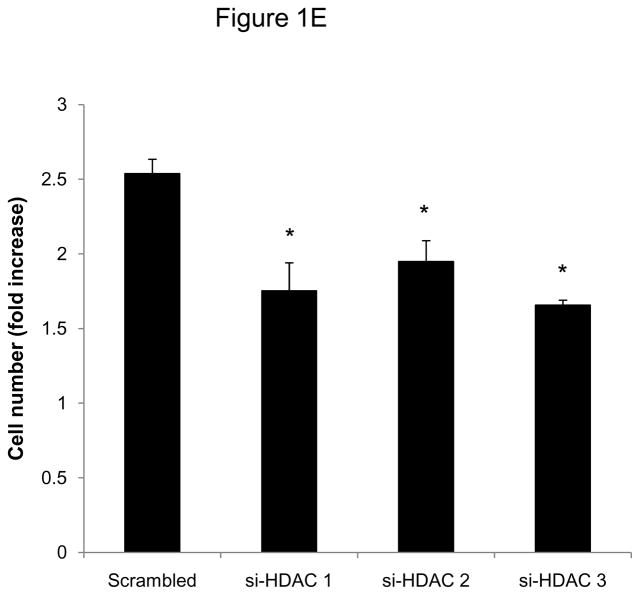
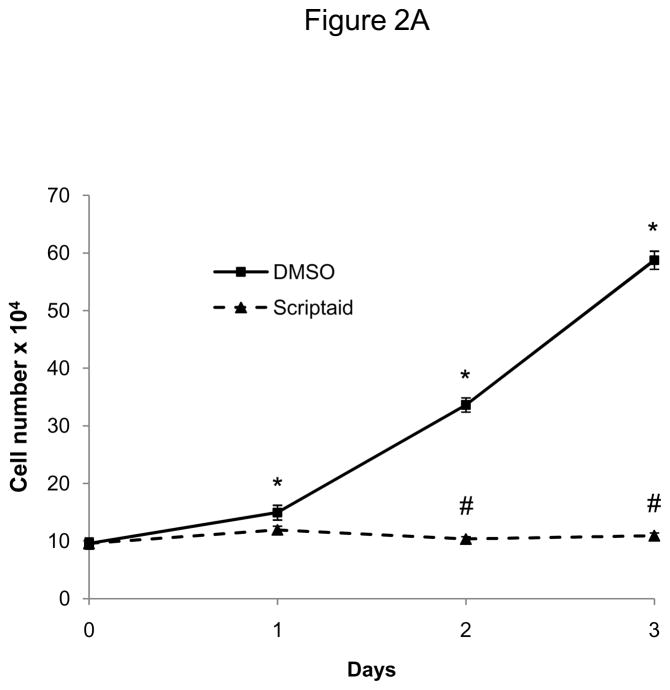
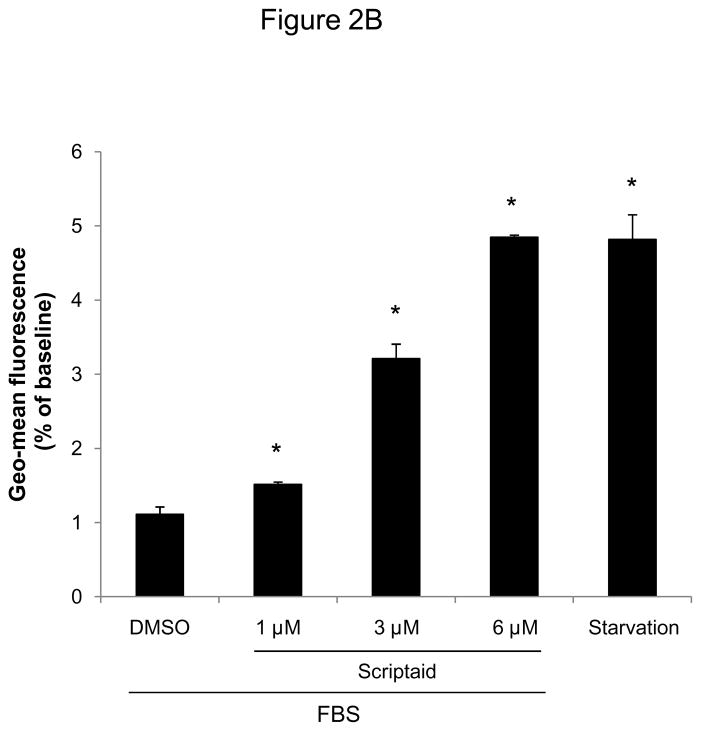
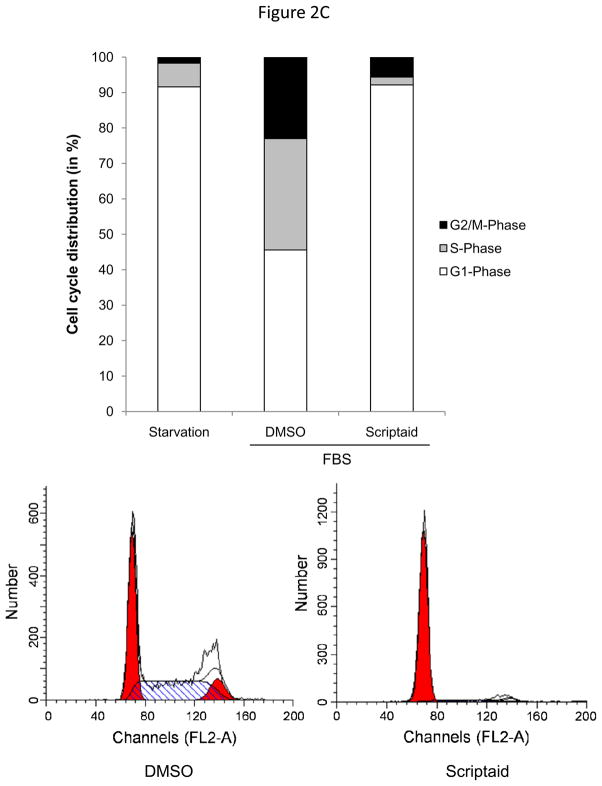
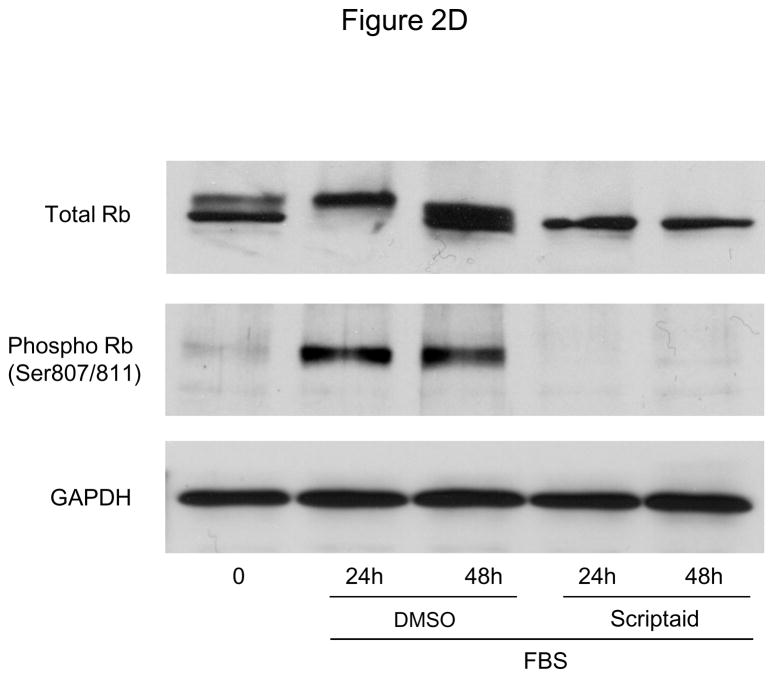
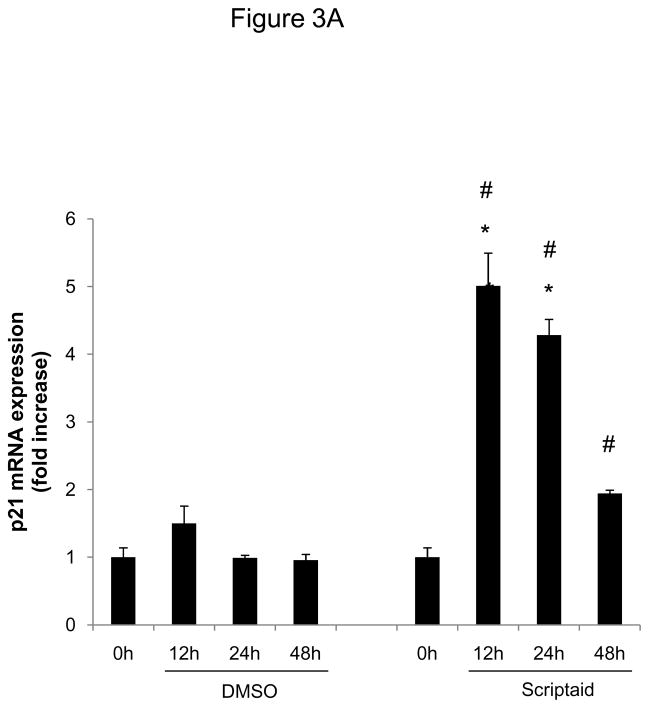
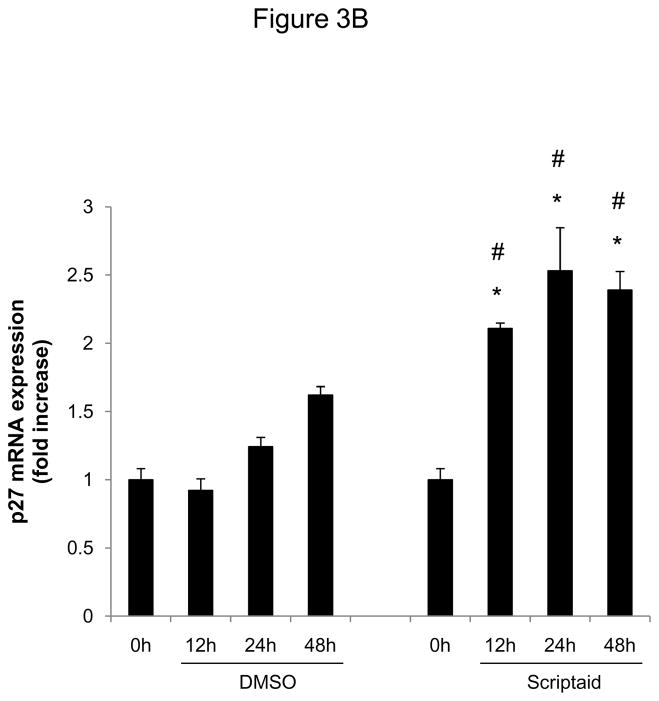
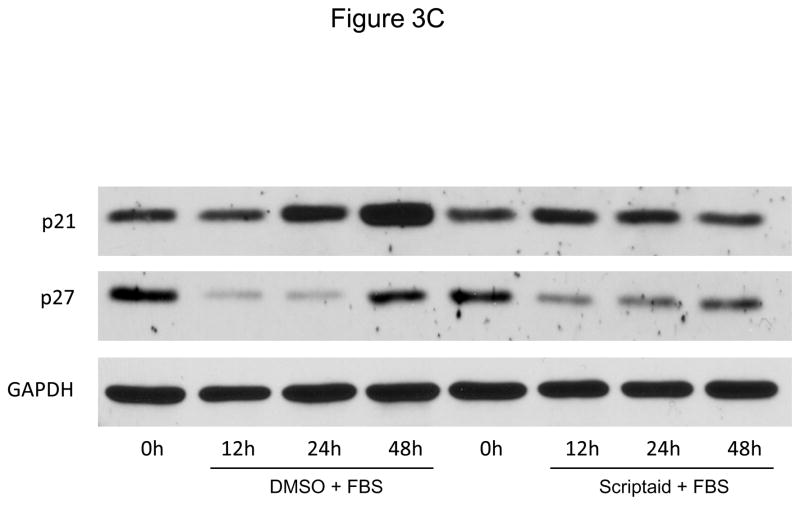
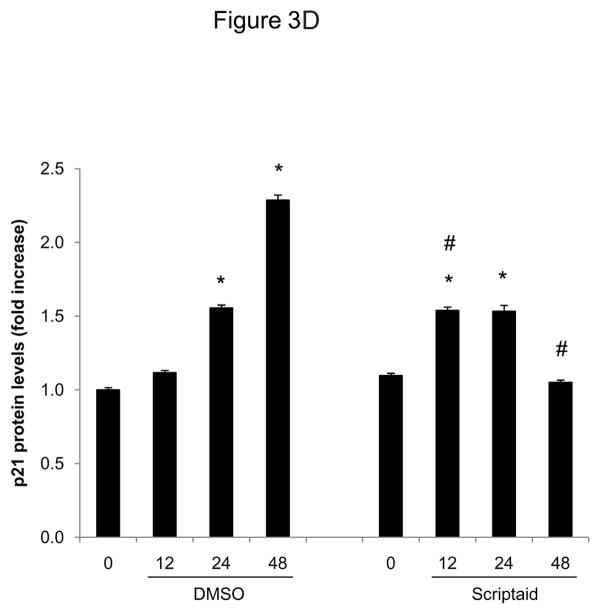
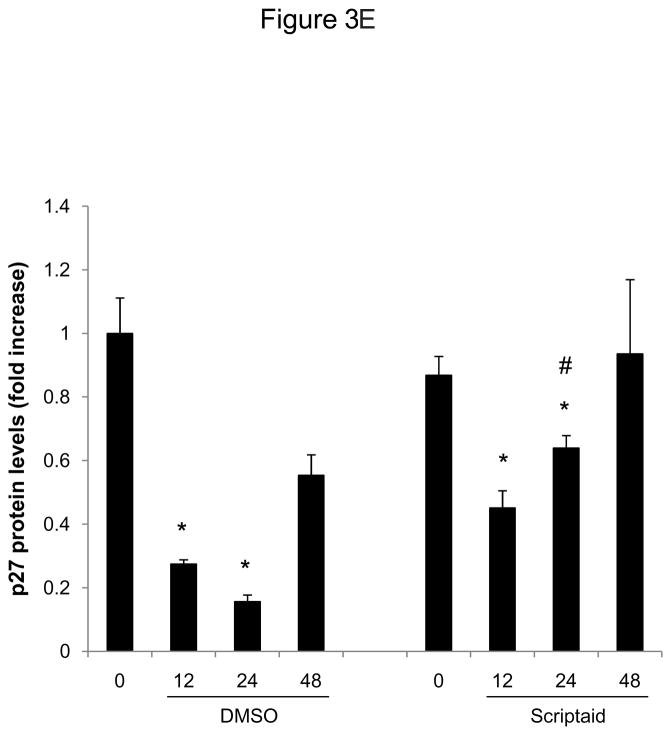
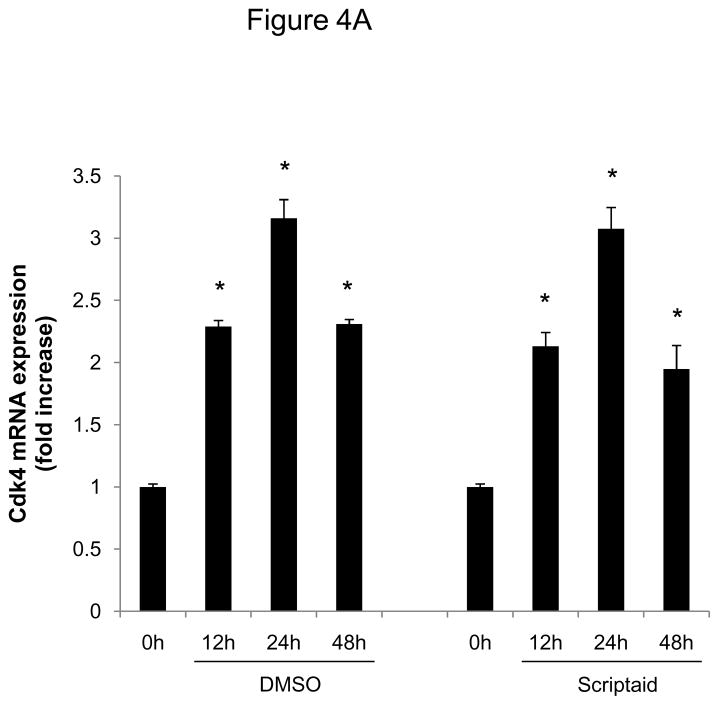
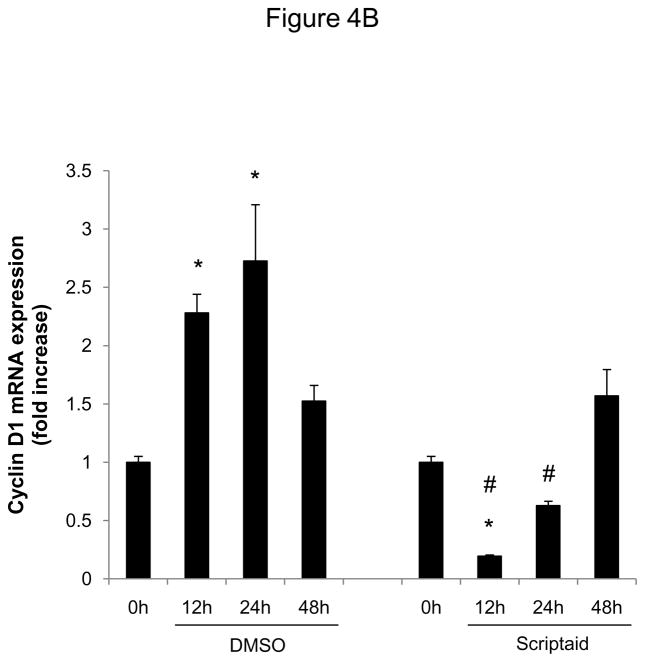
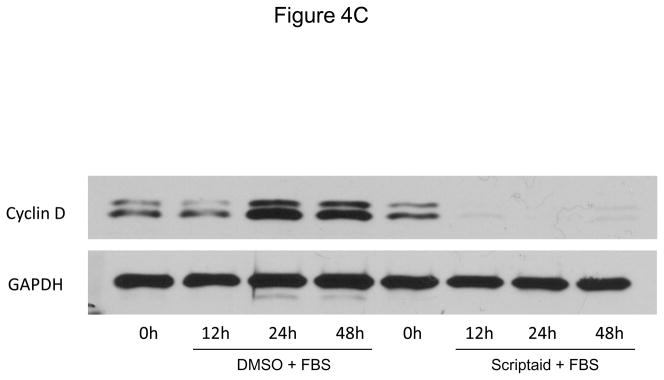
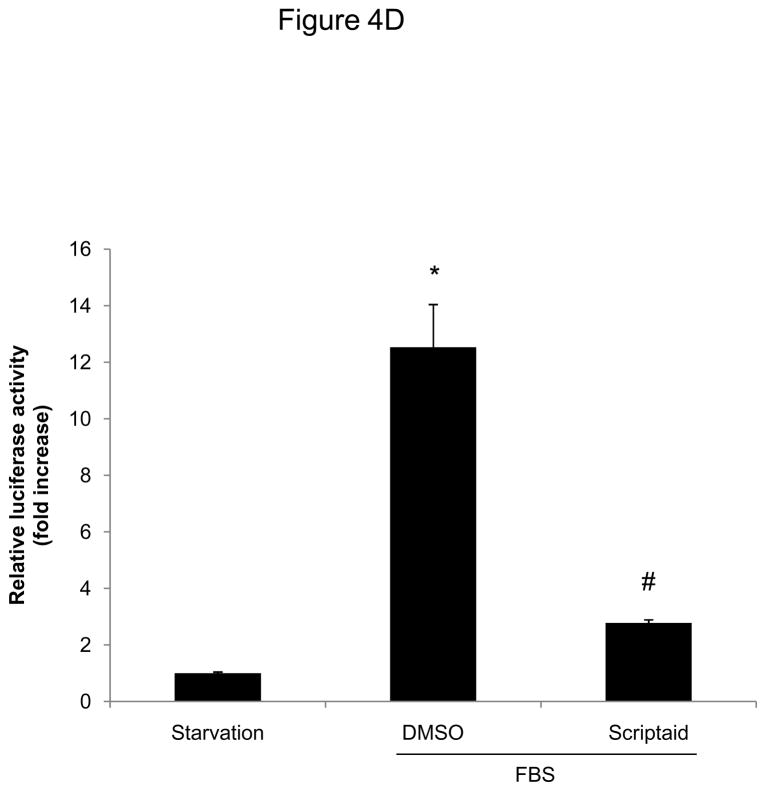
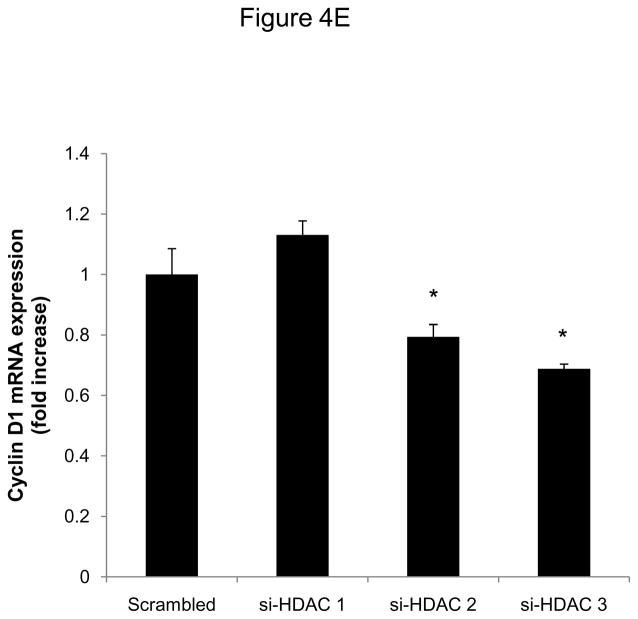
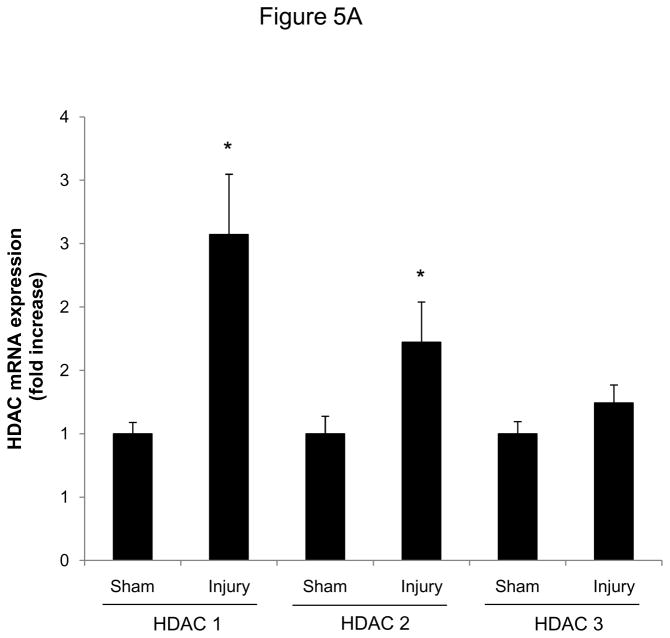
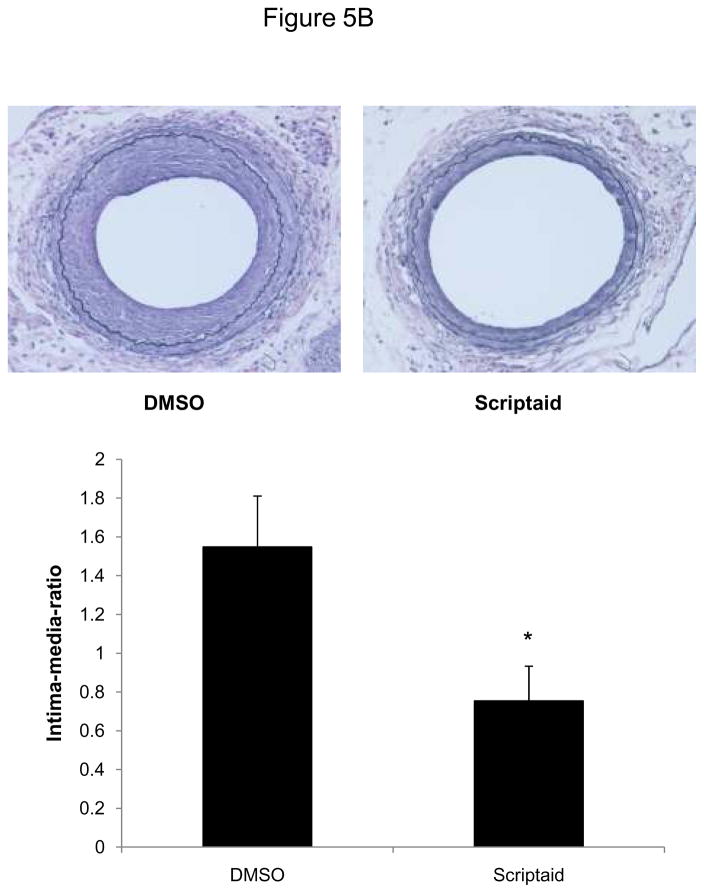
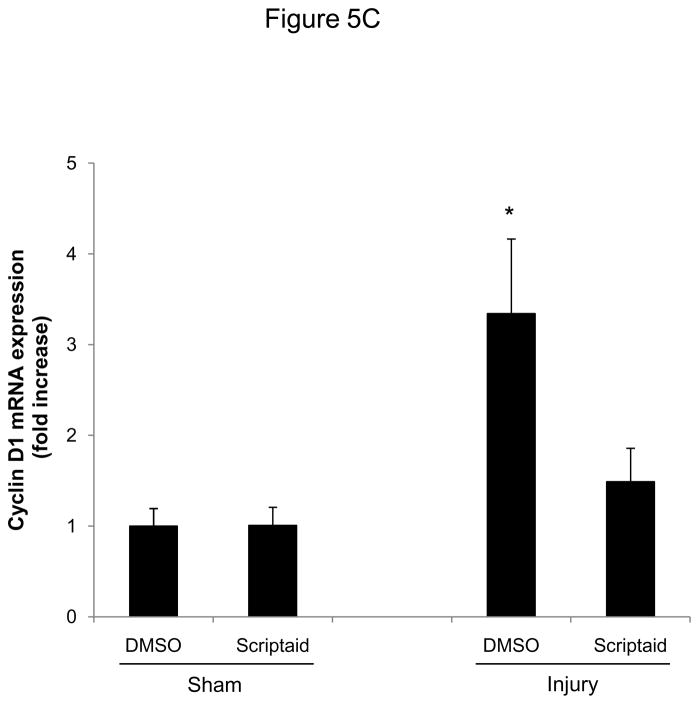
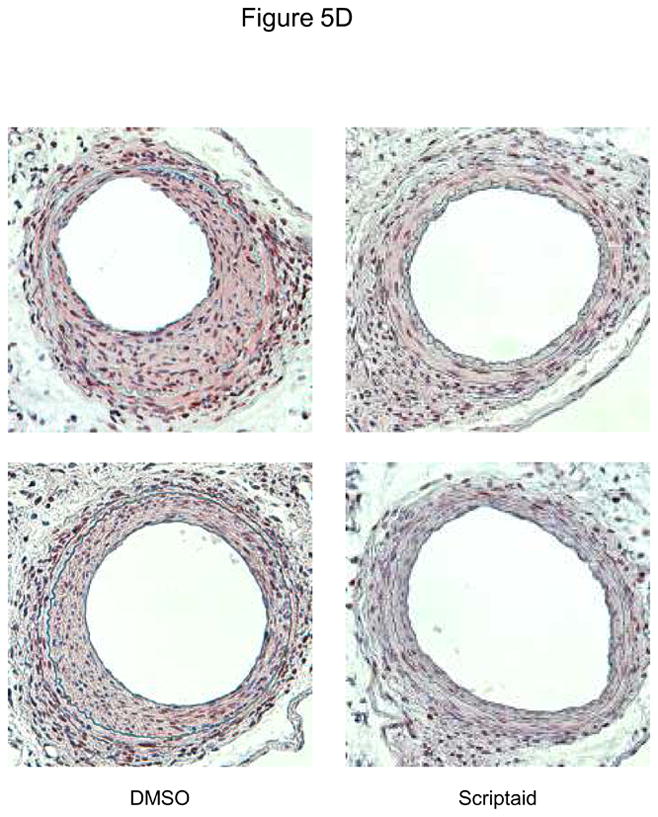
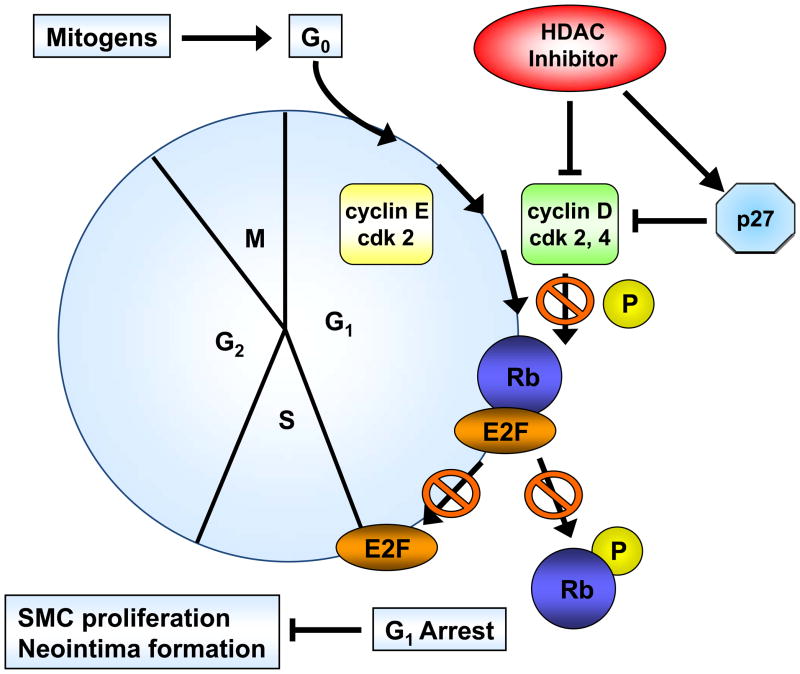
Methods and results: In the present study, we investigated the role of histone deacetylase (HDAC) inhibition in SMC proliferation and neointimal remodeling. We demonstrate that mitogens induce transcription of HDAC 1, 2, and 3 in SMC. Short interfering RNA-mediated knockdown of either HDAC 1, 2, or 3 and pharmacological inhibition of HDAC prevented mitogen-induced SMC proliferation. The mechanisms underlying this reduction of SMC proliferation by HDAC inhibition involve a growth arrest in the G(1) phase of the cell cycle that is due to an inhibition of retinoblastoma protein phosphorylation. HDAC inhibition resulted in a transcriptional and posttranscriptional regulation of the cyclin-dependent kinase inhibitors p21(Cip1) and p27(Kip). Furthermore, HDAC inhibition repressed mitogen-induced cyclin D1 mRNA expression and cyclin D1 promoter activity. As a result of this differential cell cycle-regulatory gene expression by HDAC inhibition, the retinoblastoma protein retains a transcriptional repression of its downstream target genes required for S phase entry. Finally, we provide evidence that these observations are applicable in vivo by demonstrating that HDAC inhibition decreased neointima formation and expression of cyclin D1 in a murine model of vascular injury.

Conclusions: These findings identify HDAC as a critical component of a transcriptional cascade regulating SMC proliferation and suggest that HDAC might play a pivotal role in the development of proliferative vascular diseases, including atherosclerosis and in-stent restenosis.


Conflict of interest statement

Disclosure - The authors have nothing to disclose that could be perceived as real or apparent conflict(s) of interest.

Figures

Figure 1
Figure 1
Mitogenic stimulation of SMC induces class I HDAC expression. A–D: Serum-deprived rat aortic SMC were stimulated with 10% FBS. HDAC mRNA and protein expression was analyzed at the indicated time points. The autoradiograms shown are representative of three independently performed experiments using different cell preparations. E: Cells were transfected twice with siRNA against HDAC 1, 2, 3 and serum-deprived for 24 h. Following this starvation period, synchronized cells were stimulated with 10 % FBS for 48 h and counted using a hemocytometer. Data is presented as mean ± SEM (* p < 0.05 vs. baseline or scrambled siRNA).
Figure 1
Figure 1
Mitogenic stimulation of SMC induces class I HDAC expression. A–D: Serum-deprived rat aortic SMC were stimulated with 10% FBS. HDAC mRNA and protein expression was analyzed at the indicated time points. The autoradiograms shown are representative of three independently performed experiments using different cell preparations. E: Cells were transfected twice with siRNA against HDAC 1, 2, 3 and serum-deprived for 24 h. Following this starvation period, synchronized cells were stimulated with 10 % FBS for 48 h and counted using a hemocytometer. Data is presented as mean ± SEM (* p < 0.05 vs. baseline or scrambled siRNA).
Figure 2
Figure 2
The HDAC inhibitor Scriptaid prevents mitogen-induced SMC proliferation. A: Serum-deprived SMC were pretreated with DMSO or 6 μM Scriptaid, and stimulated with 10% FBS. Cells were counted at indicated time points using a hemocytometer. B: CFSE labeled SMC were starved for 24 h, treated with DMSO or different doses of Scriptaid, and stimulated with 10% FBS. After 48 h cells were analyzed by FACS. C: SMC were treated as described in A. Cell cycle distribution was assessed at baseline and 24 h after FBS stimulation using FACS analysis. D: Cells were stimulated as described in A. Whole cell lysate was collected at the indicated time points and analyzed for protein expression of total Rb, phosphorylated Rb and GAPDH. The autoradiograms shown are representative of three independently performed experiments using different cell preparations. Data is presented as mean ± SEM (* p < 0.05 vs. DMSO).
Figure 2
Figure 2
The HDAC inhibitor Scriptaid prevents mitogen-induced SMC proliferation. A: Serum-deprived SMC were pretreated with DMSO or 6 μM Scriptaid, and stimulated with 10% FBS. Cells were counted at indicated time points using a hemocytometer. B: CFSE labeled SMC were starved for 24 h, treated with DMSO or different doses of Scriptaid, and stimulated with 10% FBS. After 48 h cells were analyzed by FACS. C: SMC were treated as described in A. Cell cycle distribution was assessed at baseline and 24 h after FBS stimulation using FACS analysis. D: Cells were stimulated as described in A. Whole cell lysate was collected at the indicated time points and analyzed for protein expression of total Rb, phosphorylated Rb and GAPDH. The autoradiograms shown are representative of three independently performed experiments using different cell preparations. Data is presented as mean ± SEM (* p < 0.05 vs. DMSO).
Figure 3
Figure 3
HDAC inhibition modifies the expression of cyclin-dependent kinase inhibitors. A–C: Serum-deprived SMC were treated with DMSO or 6 μM Scriptaid, and stimulated with 10% FBS. Cells were harvested at the indicated time points and analyzed for mRNA and protein expression of p21Cip1 and p27Kip1 by real-time RT-PCR (A–B) and Western blotting (C). Quantification of the Western blotting experiments was performed by densitometry and normalization to GAPDH from three independently performed experiments. Data is presented as mean ± SEM (* p < 0.05 vs. baseline, # p < 0.05 vs. DMSO).
Figure 3
Figure 3
HDAC inhibition modifies the expression of cyclin-dependent kinase inhibitors. A–C: Serum-deprived SMC were treated with DMSO or 6 μM Scriptaid, and stimulated with 10% FBS. Cells were harvested at the indicated time points and analyzed for mRNA and protein expression of p21Cip1 and p27Kip1 by real-time RT-PCR (A–B) and Western blotting (C). Quantification of the Western blotting experiments was performed by densitometry and normalization to GAPDH from three independently performed experiments. Data is presented as mean ± SEM (* p < 0.05 vs. baseline, # p < 0.05 vs. DMSO).
Figure 4
Figure 4
HDAC inhibition represses cyclin D1 transcription. A and B: Serum-deprived SMC were treated with DMSO or 6 μM Scriptaid, and stimulated with 10% FBS. Cells were harvested at indicated time points and analyzed for mRNA expression of Cdk4 (A) and cyclin D1 (B). C: Cells were treated as described in A. Whole cell lysate was collected and analyzed for protein expression of cyclin D1. D: SMC were transfected with a cyclin D1 promoter luciferase reporter plasmid. Following transfection, cells were treated with DMSO or 6 μM Scriptaid in 10% FBS. Luciferase activity was assayed after 24 h. Transfection efficiency was adjusted by normalizing firefly luciferase activities to renilla luciferase activities generated by cotransfection with pRL-CMV. E: Cells were transfected twice with siRNA against HDAC 1, 2, 3 and serum-deprived for 24 h. Following this starvation period, synchronized cells were stimulated with 50 ng/ml PDGF and mRNA expression of cyclin D1 was analyzed after 6h. Data is presented as mean ± SEM (* p < 0.05 vs. baseline or scrambled siRNA, # p < 0.05 vs. DMSO).
Figure 4
Figure 4
HDAC inhibition represses cyclin D1 transcription. A and B: Serum-deprived SMC were treated with DMSO or 6 μM Scriptaid, and stimulated with 10% FBS. Cells were harvested at indicated time points and analyzed for mRNA expression of Cdk4 (A) and cyclin D1 (B). C: Cells were treated as described in A. Whole cell lysate was collected and analyzed for protein expression of cyclin D1. D: SMC were transfected with a cyclin D1 promoter luciferase reporter plasmid. Following transfection, cells were treated with DMSO or 6 μM Scriptaid in 10% FBS. Luciferase activity was assayed after 24 h. Transfection efficiency was adjusted by normalizing firefly luciferase activities to renilla luciferase activities generated by cotransfection with pRL-CMV. E: Cells were transfected twice with siRNA against HDAC 1, 2, 3 and serum-deprived for 24 h. Following this starvation period, synchronized cells were stimulated with 50 ng/ml PDGF and mRNA expression of cyclin D1 was analyzed after 6h. Data is presented as mean ± SEM (* p < 0.05 vs. baseline or scrambled siRNA, # p < 0.05 vs. DMSO).
Figure 5
Figure 5
HDAC inhibition reduces neointima formation following vascular injury. A: Guide wire-induced endothelial denudation injuries were performed on the left femoral artery of C57BL/6J mice (n = 4). mRNA expression of HDAC 1–3 was analyzed after 48 h. B: Following endothelial denudation injuries, mice were treated with Scriptaid or DMSO for 28 days (n = 9 each group). Tissues were harvested and elastic Verhoeff-van Gieson stain was performed to visualize the internal and external elastic lamina. The ratio of intima to media was calculated as the intimal area divided by medial area. C: Cyclin D1 mRNA expression was analyzed 48 after endothelial denudation injuries (each group n = 4) or sham surgery (each group n = 3) and treatment with Scriptaid or DMSO. D: Representative immunohistochemical stainings of PCNA expression. Tissues were harvested after 28 days of Scriptaid or DMSO treatment. Data is presented as mean ± SEM (* p < 0.05 vs. baseline)
Figure 5
Figure 5
HDAC inhibition reduces neointima formation following vascular injury. A: Guide wire-induced endothelial denudation injuries were performed on the left femoral artery of C57BL/6J mice (n = 4). mRNA expression of HDAC 1–3 was analyzed after 48 h. B: Following endothelial denudation injuries, mice were treated with Scriptaid or DMSO for 28 days (n = 9 each group). Tissues were harvested and elastic Verhoeff-van Gieson stain was performed to visualize the internal and external elastic lamina. The ratio of intima to media was calculated as the intimal area divided by medial area. C: Cyclin D1 mRNA expression was analyzed 48 after endothelial denudation injuries (each group n = 4) or sham surgery (each group n = 3) and treatment with Scriptaid or DMSO. D: Representative immunohistochemical stainings of PCNA expression. Tissues were harvested after 28 days of Scriptaid or DMSO treatment. Data is presented as mean ± SEM (* p < 0.05 vs. baseline)
Figure 6
Figure 6
HDAC inhibition targets cell cycle progression. Cell cycle progression is dependent on the orchestrated expression, activation and holoenzyme formation of cyclins and cyclin-dependent kinases (CDKs). HDAC inhibition blocks cell cycle progression through repression of cyclin D1. Impaired activation of cyclin–CDK complexes inhibits mitogen-induced Rb phosphorylation and downstream activation of E2F-regulated genes, resulting in G1 arrest and reduced SMC proliferation.

Comment in

References

    1. Dzau VJ, Braun-Dullaeus RC, Sedding DG. Vascular proliferation and atherosclerosis: New perspectives and therapeutic strategies. Nat Med. 2002;8:1249–1256. - PubMed
    1. Doran AC, Meller N, McNamara CA. Role of smooth muscle cells in the initiation and early progression of atherosclerosis. Arterioscler Thromb Vasc Biol. 2008;28:812–819. - PMC - PubMed
    1. Moses JW, Leon MB, Popma JJ, Fitzgerald PJ, Holmes DR, O’Shaughnessy C, Caputo RP, Kereiakes DJ, Williams DO, Teirstein PS, Jaeger JL, Kuntz RE the SIRIUS Investigators. Sirolimus-eluting stents versus standard stents in patients with stenosis in a native coronary artery. N Engl J Med. 2003;349:1315–1323. - PubMed
    1. Zhang QJ, Goddard M, Shanahan C, Shapiro L, Bennett M. Differential gene expression in vascular smooth muscle cells in primary atherosclerosis and in stent stenosis in humans. Arterioscler Thromb Vasc Biol. 2002;22:2030–2036. - PubMed
    1. Li B, Carey M, Workman JL. The role of chromatin during transcription. Cell. 2007;128:707–719. - PubMed

Publication types

MeSH terms