

doi: 10.1155/2011/541405.
Epub 2010 Dec 27.
Deciphering squamous cell carcinoma using multidimensional genomic approaches
Affiliations
- PMID: 21234096
- PMCID: PMC3017908
- DOI: 10.1155/2011/541405
Item in Clipboard
Deciphering squamous cell carcinoma using multidimensional genomic approaches
J Skin Cancer.
2011.
Abstract
Squamous cell carcinomas (SqCCs) arise in a wide range of tissues including skin, lung, and oral mucosa. Although all SqCCs are epithelial in origin and share common nomenclature, these cancers differ greatly with respect to incidence, prognosis, and treatment. Current knowledge of genetic similarities and differences between SqCCs is insufficient to describe the biology of these cancers, which arise from diverse tissue origins. In this paper we provide a general overview of whole genome approaches for gene and pathway discovery and highlight the advancement of integrative genomics as a state-of-the-art technology in the study of SqCC genetics.
Figures
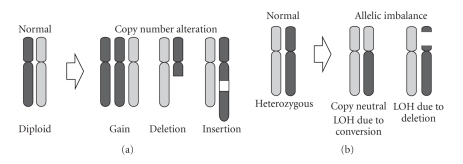
Mechanisms of DNA copy number alteration. (a) Segmental gains and losses can lead to DNA copy number alterations. (b) Allelic imbalance and loss of heterozygosity (LOH) can arise from a deletion event or gene conversion during mitosis.
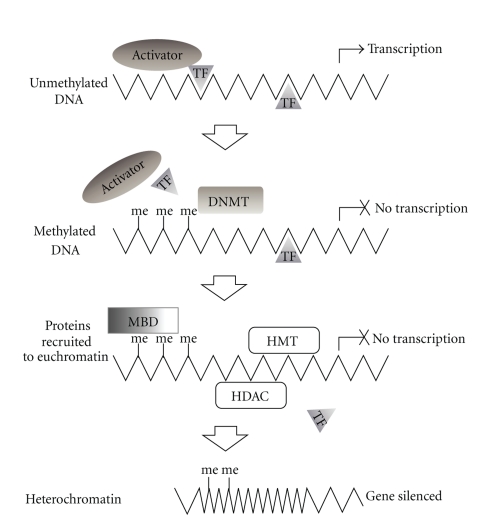
Mechanisms of epigenetic gene silencing. Unmethylated DNA is accessible to activator proteins and transcription factors (TF) enabling transcription. DNA methylation by DNA methyl transferases (DNMT) causes steric inhibition of transcription complexes thus blocking transcription. Methylated DNA (me) is recognized by methyl binding domain proteins (MBD), histone deacetylases (HDAC), and histone methyltransferases (HMT) which stimulate chromatin remodeling. Compaction of DNA into condensed chromatin (heterochromatin) results in transcriptionally inactive DNA.
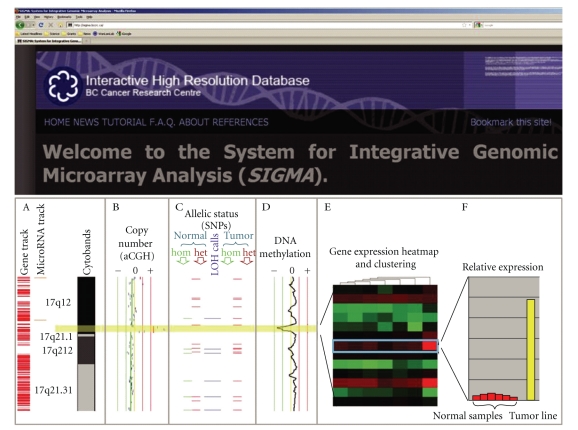
Multidimensional omics data integration using SIGMA2 software. Combined genetic, epigenetic and gene expression analysis of cancer samples facilitates identification of oncogenes and tumor suppressor genes which are concertedly disrupted. (a) Examples of annotation tracks. (b) Copy number profile from array CGH experiment—a focal DNA amplification of a region on 17q12 is highlighted in yellow. (c) Allelic status (SNP array). This region is also encompassed in a large stretch of allelic imbalance. Blue horizontal bars indicate loci that become homozygous (loss of heterozygosity) in the tumor sample. (d) DNA methylation analysis (MeDIP-microarray) shows a concurrent loss of methylation, as indicated by a peak shifted to left of the center line. (e) Heat map summary of gene expression profile in the region of interest. The gene boxed in blue on the heatmap is ERBB2. It shows the highest level of differential expression between the tumor line and a panel of normal tissue samples. (f) The histogram displays the relative expression of the tumor sample as compared with the normal samples for ERBB2 (i.e., expanded view from heat map).
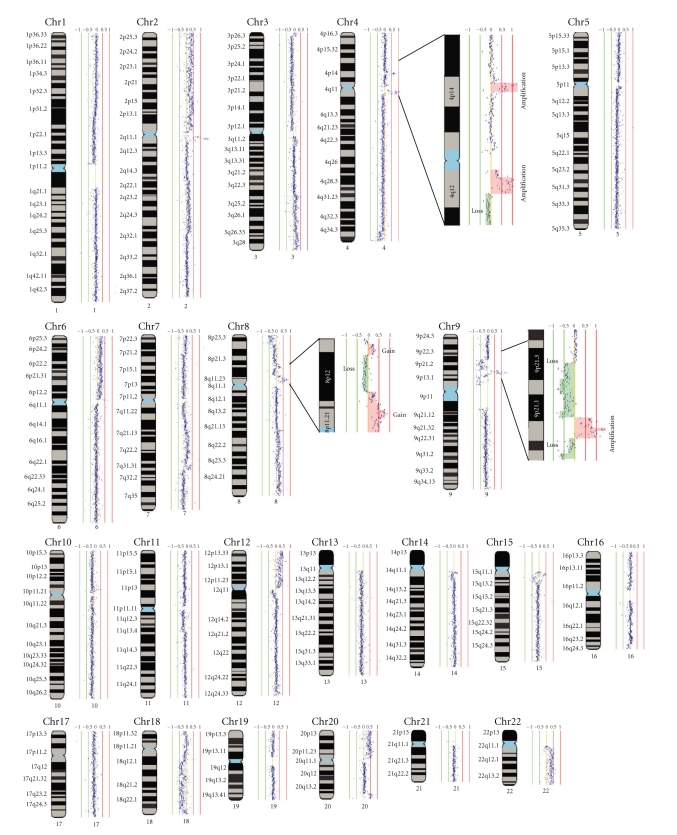
Whole-genome tiling-path array profile of an oral low-grade dysplasia. Normalized log2 signal intensity ratios were plotted using SIGMA software [85, 86]. Cytoband pattern corresponding to the data points was drawn to the left of each data plot. The red and green vertical lines represent signal intensity ratios from −1 to +1 with an increment of 0.5. The magnified insets (for regions of chromosome 4, 8, and 9) include segmental copy number gain highlighted in orange and copy number loss highlighted green.
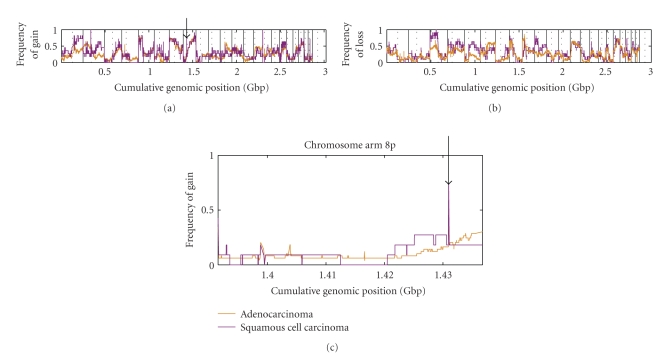
Genome-wide comparison of lung adenocarcinoma (AC) and squamous cell carcinoma (SqCC). Affymetrix SNP 6.0 data for 11 SqCC and 49 AC cell lines were downloaded from the Wellcome Trust Sanger Cancer Genome Project. Data were analyzed against a pool of a normal reference samples using Partek Genomics Suite. For each position in the genome, the frequency of (a) gain and (b) loss are shown for SqCC (purple) and AC (orange). (c) Magnified view of chromosome arm 8p shows that SqCC has a higher frequency of segmental DNA gain at cumulative position 1.43 Gbp as compared to AC.
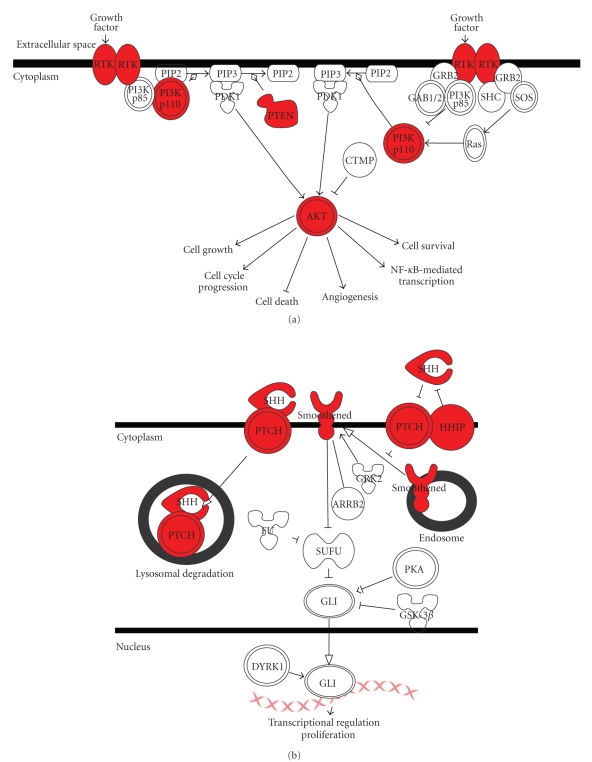
Major pathways affected in NMSC. (a) SqCC undergoes frequent alterations to the PI3K/AKT signaling pathway. (b) BCC undergoes frequent alterations to the sonic hedgehog pathway. Various pathway components affected are highlighted in red.
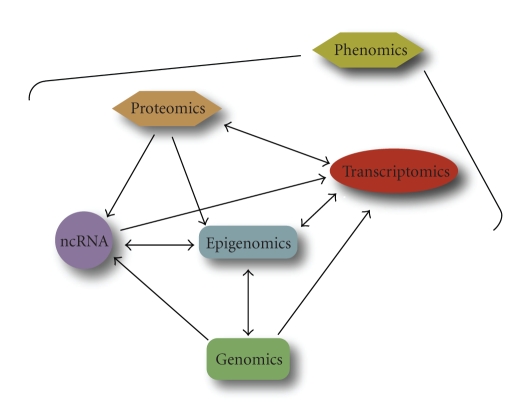
The integrated network of genome-wide analyses comprising the cancer omics landscape. Phenomics or phenotypic effects are the direct consequence of the perturbations of genes and pathways which could be traced to genetic and epigenetic alterations when multiple dimensions of information are integrated to connect upstream causes with downstream effects.
References
-
- Hanahan D, Weinberg RA. The hallmarks of cancer. Cell. 2000;100(1):57–70. - PubMed
-
- de Klein A. Oncogene activation by chromosomal rearrangement in chronic myelocytic leukemia. Mutation Research. 1987;186(2):161–172. - PubMed
-
- Haluska FG, Tsujimoto Y, Croce CM. Oncogene activation by chromosome translocation in human malignancy. Annual Review of Genetics. 1987;21:321–345. - PubMed
-
- Dessars B, de Raeve LE, Housni HE, et al. Chromosomal translocations as a mechanism of BRAF activation in two cases of large congenital melanocytic nevi. Journal of Investigative Dermatology. 2007;127(6):1468–1470. - PubMed
Grants and funding
LinkOut - more resources
Full Text Sources
