

The selection and use of sorghum (Sorghum propinquum) bacterial artificial chromosomes as cytogenetic FISH probes for maize (Zea mays L.)
- PMID: 21234422
- PMCID: PMC3014715
- DOI: 10.1155/2011/386862
The selection and use of sorghum (Sorghum propinquum) bacterial artificial chromosomes as cytogenetic FISH probes for maize (Zea mays L.)
Abstract
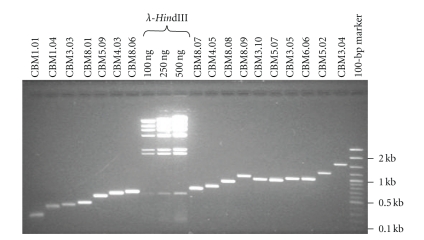
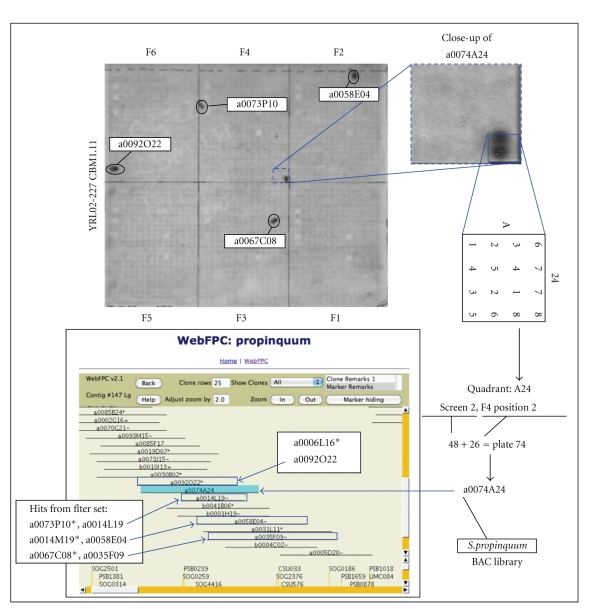
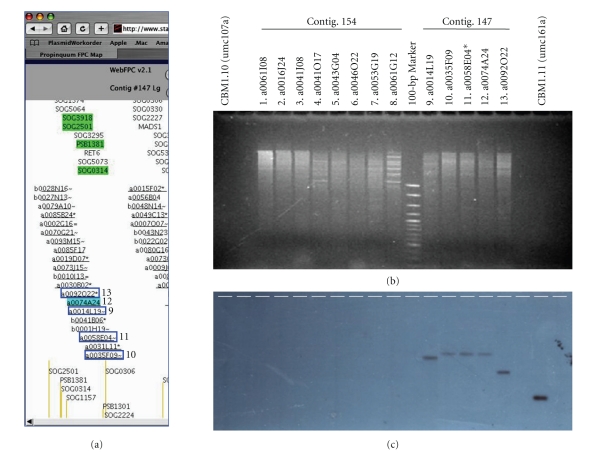
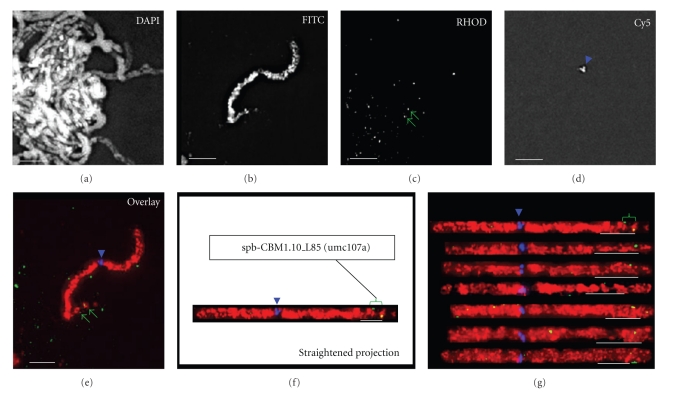
The integration of genetic and physical maps of maize is progressing rapidly, but the cytogenetic maps lag behind, with the exception of the pachytene fluorescence in situ hybridization (FISH) maps of maize chromosome 9. We sought to produce integrated FISH maps of other maize chromosomes using Core Bin Marker loci. Because these 1 Kb restriction fragment length polymorphism (RFLP) probes are below the FISH detection limit, we used BACs from sorghum, a small-genome relative of maize, as surrogate clones for FISH mapping. We sequenced 151 maize RFLP probes and compared in silico BAC selection methods to that of library filter hybridization and found the latter to be the best. BAC library screening, clone verification, and single-clone selection criteria are presented along with an example of transgenomic BAC FISH mapping. This strategy has been used to facilitate the integration of RFLP and FISH maps in other large-genome species.
Figures
Similar articles
-
Development of pachytene FISH maps for six maize chromosomes and their integration with other maize maps for insights into genome structure variation.Chromosome Res. 2012 May;20(4):363-80. doi: 10.1007/s10577-012-9281-4. Epub 2012 May 16. Chromosome Res. 2012. PMID: 22588802 Free PMC article.
-
A transgenomic cytogenetic sorghum (Sorghum propinquum) bacterial artificial chromosome fluorescence in situ hybridization map of maize (Zea mays L.) pachytene chromosome 9, evidence for regions of genome hyperexpansion.Genetics. 2007 Nov;177(3):1509-26. doi: 10.1534/genetics.107.080846. Epub 2007 Oct 18. Genetics. 2007. PMID: 17947405 Free PMC article.
-
A new single-locus cytogenetic mapping system for maize (Zea mays L.): overcoming FISH detection limits with marker-selected sorghum (S. propinquum L.) BAC clones.Plant J. 2003 Sep;35(5):647-59. doi: 10.1046/j.1365-313x.2003.01829.x. Plant J. 2003. PMID: 12940957
-
Mapping a new frontier; development of integrated cytogenetic maps in plants.Funct Integr Genomics. 2000 Sep;1(2):89-98. doi: 10.1007/s101420000013. Funct Integr Genomics. 2000. PMID: 11793225 Review.
-
Sequencing the maize genome.Curr Opin Plant Biol. 2004 Apr;7(2):102-7. doi: 10.1016/j.pbi.2004.01.010. Curr Opin Plant Biol. 2004. PMID: 15003207 Review.
Cited by
-
Development of pachytene FISH maps for six maize chromosomes and their integration with other maize maps for insights into genome structure variation.Chromosome Res. 2012 May;20(4):363-80. doi: 10.1007/s10577-012-9281-4. Epub 2012 May 16. Chromosome Res. 2012. PMID: 22588802 Free PMC article.
-
Intra- and interchromosomal rearrangements between cowpea [Vigna unguiculata (L.) Walp.] and common bean (Phaseolus vulgaris L.) revealed by BAC-FISH.Chromosome Res. 2015 Jun;23(2):253-66. doi: 10.1007/s10577-014-9464-2. Epub 2015 Jan 30. Chromosome Res. 2015. PMID: 25634499
References
-
- Aulard S, Monti L, Chaminade N, Lemeunier F. Mitotic and polytene chromosomes: comparisons between Drosophila melanogaster and Drosophila simulans. Genetica. 2004;120(1–3):137–150. - PubMed
-
- Figueroa DM, Bass HW. A historical andmodern perspective on plant cytogenetics. Briefings in Functional Genomics and Proteomics. 2010;9(2):95–102. - PubMed
-
- Gartler SM. The chromosome number in humans: a brief history. Nature Reviews Genetics. 2006;7(8):655–660. - PubMed
-
- Gatti M, Pimpinelli S. Cytological and genetic analysis of the Y chromosome of Drosophila melanogaster. I. Organization of the fertility factors. Chromosoma. 1983;88(5):349–373.
-
- Lozovskaya ER, Petrov DA, Hartl DL. A combined molecular and cytogenetic approach to genome evolution in Drosophila using large-fragment DNA cloning. Chromosoma. 1993;102(4):253–266. - PubMed
Publication types
MeSH terms
Substances
LinkOut - more resources
Full Text Sources
