. 2011 Dec;63(6):1001-49.
doi: 10.1007/s00285-010-0400-6. Epub 2011 Jan 14.

A theoretical analysis of filament length fluctuations in actin and other polymers

Affiliations

A theoretical analysis of filament length fluctuations in actin and other polymers

Jifeng Hu et al. J Math Biol. 2011 Dec.

Abstract

Control of the structure and dynamics of the actin cytoskeleton is essential for cell motility and for maintaining the structural integrity of cells. Central to understanding the control of these features is an understanding of the dynamics of actin filaments, first as isolated filaments, then as integrated networks, and finally as networks containing higher-order structures such as bundles, stress fibers and acto-myosin complexes. It is known experimentally that single filaments can exhibit large fluctuations, but a detailed understanding of the transient dynamics involved is still lacking. Here we first study stochastic models of a general system involving two-monomer types that can be analyzed completely, and then we report stochastic simulations on the complete actin model with three monomer types. We systematically examine the transient behavior of filament length dynamics so as to gain a better understanding of the time scales involved in reaching a steady state. We predict the lifetime of a cap of one monomer type and obtain the mean and variance of the survival time of a cap at the filament end, which together determine the filament length fluctuations.


Figures

Fig. 1
Fig. 1
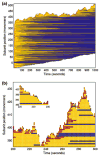
a and b The length and nucleotide profile of a single filament during the polymerizing and treadmilling phase. Here the barbed end is at the top and the pointed end at the bottom — the former growing and the latter shrinking. Black represents an ADP-containing monomer, gray ADP-Pi, and intermediate ATP-containing monomers. These correspond to blue, yellow and red respectively in online version. Time in (a) and (b) is divided into 1-s steps, whereas in the inset to (b) it is divided into 0.1-s blocks. The simulation is based on the method described in Matzavinos and Othmer (2007) using the kinetic data in Pollard (2007) and shown in Fig. 2. Initially 5,000 filaments consisting of 10 ADP-subunits polymerize in a 7.0 μM ATP actin monomer pool of 500 μm3
Fig. 2
Fig. 2
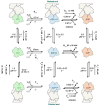
The rates associated with addition and release of the three monomer types in actin polymerization. From Pollard (2007), with permission
Fig. 3
Fig. 3
The elongation rate and diffusion constant of filament lengths as functions of the monomer concentration (from Vavylonis et al. (2005) with permission)
Fig. 4
Fig. 4
a The schematic of a polymer with a core of type B monomers and a cap of type A monomers. b Each point of the grid (m, n) represents a polymer state, where m, n are the lengths of type A and B, respectively. (α, β, r, s) are kinetic rate constants for the reactions
Fig. 5
Fig. 5
The asymptotic elongation rate (a) and the diffusion constant (b) versus the G-ATP concentration and the fragmentation rates. The kinetic constants used in the simulations are from Vavylonis et al. (2005): kT+=11.6μMs1, kT=1.4s1, kD=7.2s1
Fig. 6
Fig. 6
The asymptotic elongation rate (a) and diffusion constant (b) versus the G-ATP concentration and the hydrolysis rate. The kinetic constants used in the simulations are from Vavylonis et al. (2005): kT+=11.6μMs1, kT=1.4s1, kD=7.2s1. The leftmost line in (a) represents the critical concentration of G-ATP as in (192), whereas the rightmost line depicts the concentrations, c=(kT+h)/kT+, at which the elongation rate curve changes slope
Fig. 7
Fig. 7
A cross-section of Fig. 6b showing the maximum diffusion coefficient as a function of the hydrolysis rate
Fig. 8
Fig. 8
The asymptotic elongation rate (a) and diffusion constant (b) versus the G-ATP concentration for two hydrolysis rates, using the kinetic constants in Fig. 6. Note that vectorial hydrolysis reduces the diffusion constant fluctuation near the critical concentration
Fig. 9
Fig. 9
One stochastic realization showing the filament fluctuations at various fixed G-ATP concentrations for a long filament initially composed of G-ADP only. The y-axis represents transient length of ADP-, ATP-portion and whole filament relative to their initial sizes. The kinetic rate constants are as in Fig. 6, except (a) kT+c=1.5s1, (b) kT+c=1.68s1, (c) kT+c=1.7s1, (d) kT+c=1.75s1
Fig. 10
Fig. 10
The asymptotic elongation rate (a) and diffusion constant (b) of actin filaments at various fixed G-ATP concentrations. Both the elongation rate and the diffusion constant are averaged over 4,000 realizations. Model-I: full three state model with kinetic rate constant shown in Fig. 2 from Pollard (2007), with both ends free and rapid Pi release at the tip (ri = 2 s−1); Model-II: same as Model I, but with uniform slow Pi release (ri = 0.003 s−1); Model-III: same as Model I, but with only the barbed end free and rapid Pi release at the tip; Model-IV: three-state filament with only barbed end free, uniform slow Pi release and kinetic rate constants from Vavylonis et al. (2005). Note that results from Model I and III are indistinguishable in the figure
Fig. 11
Fig. 11
The elongation rate (a) and diffusion constant (b) of the filament barbed end at large times. The kinetic constants used in the simulations are: kT+=11.6μMs1, kT=1.4s1, kD=7.2s1. The circles represent results of stochastic simulations, whereas the line is predicted according to (98), (104) and (121)

Similar articles

Cited by

References

    1. Abramowitz M, Stegun I. Handbook of mathematical functions. 1965.
    1. Alexander M, Oster G. Cell motility driven by actin polymerization. Biophys J. 1996;71(6):3030–3045. - PMC - PubMed
    1. Bugyi B, Carlier MF. Control of actin filament treadmilling in cell motility. Annu Rev Biophys. 2010;39:449–470. - PubMed
    1. Carlier MF, Pantaloni D, Korn ED. The effects of Mg2+ at the high-affinity and low-affinity sites on the polymerization of actin and associated ATP hydrolysis. J Biol Chem. 1986;261:10785–10792. - PubMed
    1. Carlsson AE. Model of reduction of actin polymerization forces by ATP hydrolysis. Phys Biol. 2008;5(3):1–9. - PubMed

Publication types

LinkOut - more resources