Review
. 2011 Jan 14;13(1):7.
doi: 10.1186/1532-429X-13-7.

Comprehensive 4D velocity mapping of the heart and great vessels by cardiovascular magnetic resonance

Affiliations
Review

Comprehensive 4D velocity mapping of the heart and great vessels by cardiovascular magnetic resonance

Michael Markl et al. J Cardiovasc Magn Reson. .

Abstract

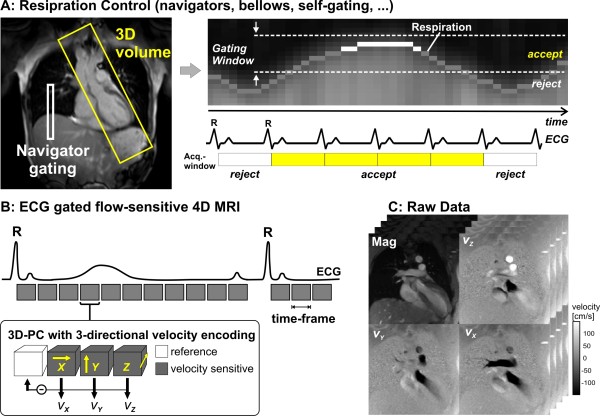
Background: Phase contrast cardiovascular magnetic resonance (CMR) is able to measure all three directional components of the velocities of blood flow relative to the three spatial dimensions and the time course of the heart cycle. In this article, methods used for the acquisition, visualization, and quantification of such datasets are reviewed and illustrated.

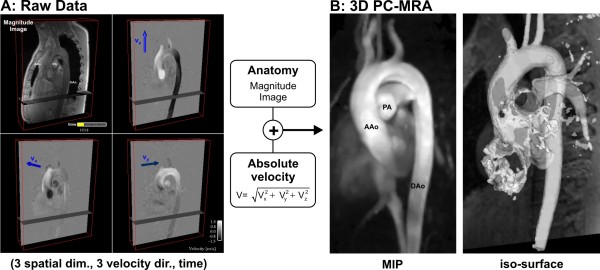
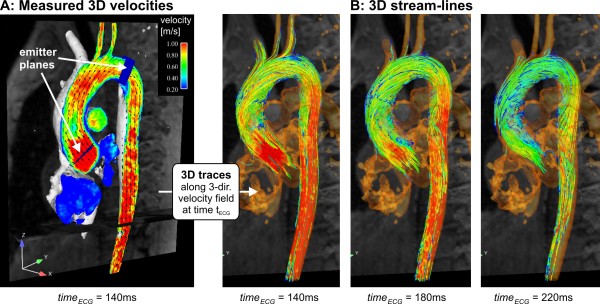
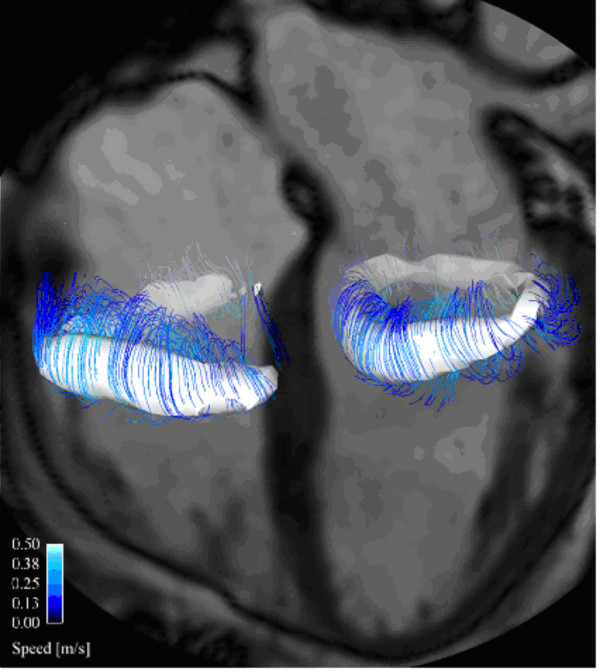
Methods: Currently, the acquisition of 3D cine (4D) phase contrast velocity data, synchronized relative to both cardiac and respiratory movements takes about ten minutes or more, even when using parallel imaging and optimized pulse sequence design. The large resulting datasets need appropriate post processing for the visualization of multidirectional flow, for example as vector fields, pathlines or streamlines, or for retrospective volumetric quantification.

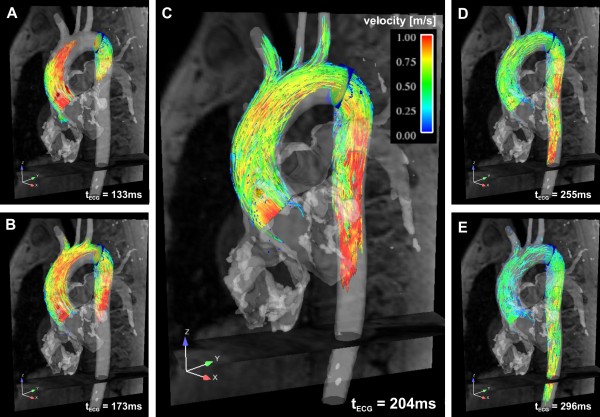
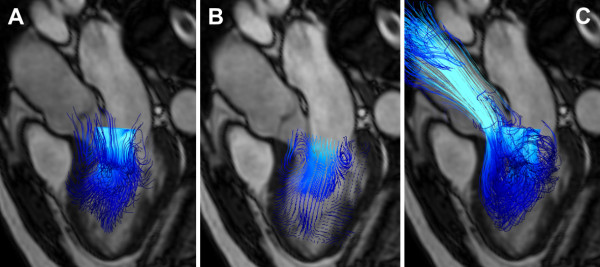
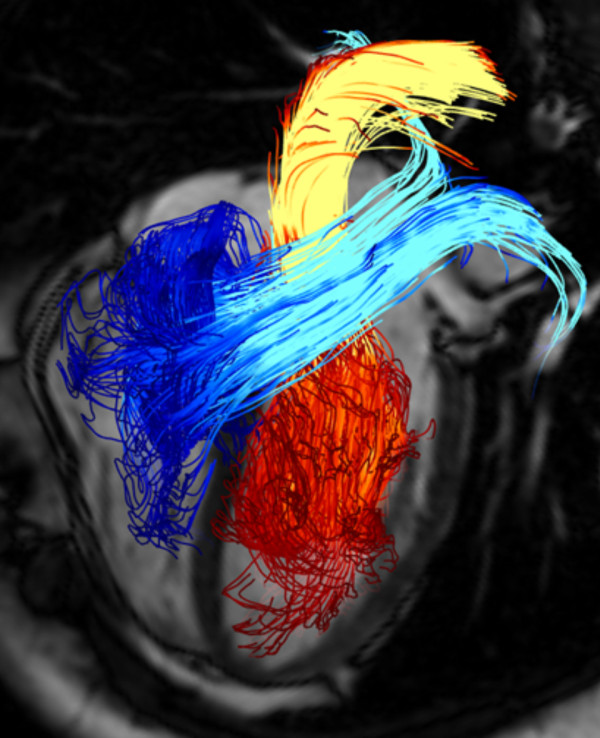
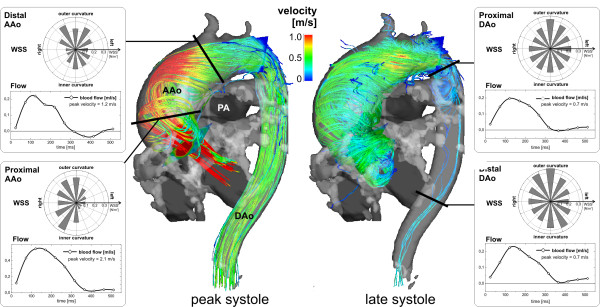
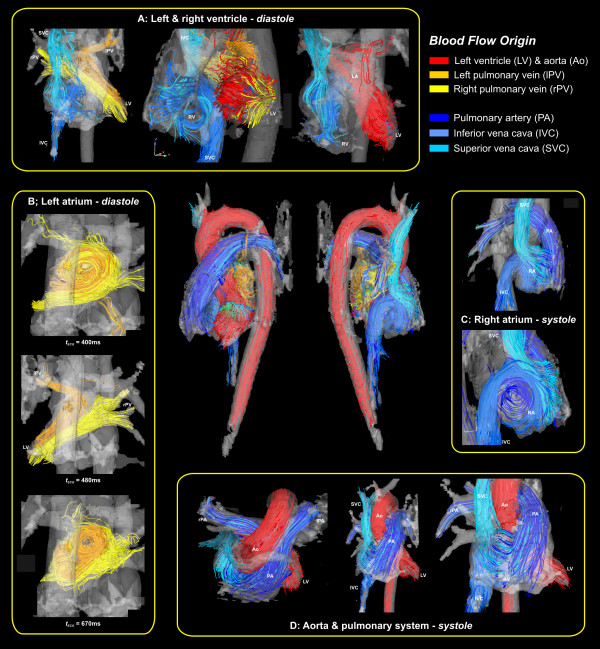
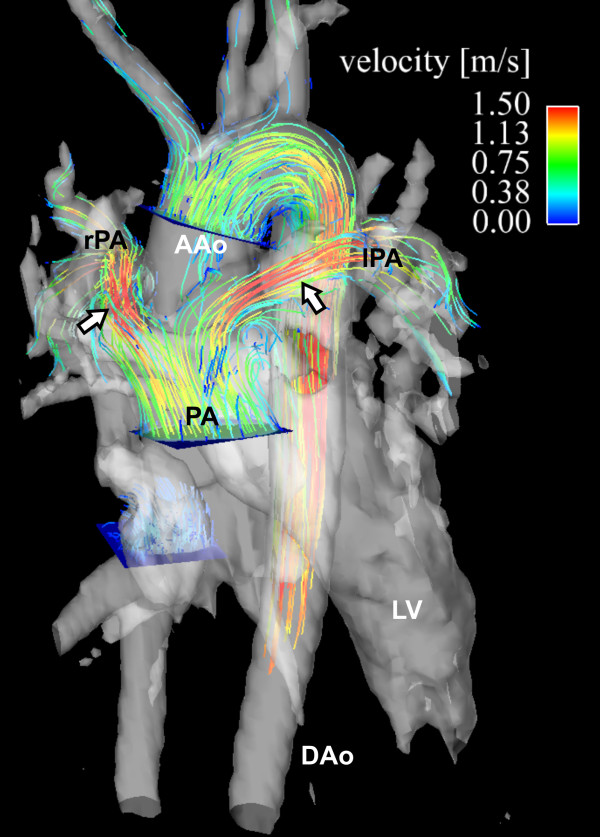
Applications: Multidirectional velocity acquisitions have provided 3D visualization of large scale flow features of the healthy heart and great vessels, and have shown altered patterns of flow in abnormal chambers and vessels. Clinically relevant examples include retrograde streams in atheromatous descending aortas as potential thrombo-embolic pathways in patients with cryptogenic stroke and marked variations of flow visualized in common aortic pathologies. Compared to standard clinical tools, 4D velocity mapping offers the potential for retrospective quantification of flow and other hemodynamic parameters.

Conclusions: Multidirectional, 3D cine velocity acquisitions are contributing to the understanding of normal and pathologically altered blood flow features. Although more rapid and user-friendly strategies for acquisition and analysis may be needed before 4D velocity acquisitions come to be adopted in routine clinical CMR, their capacity to measure multidirectional flows throughout a study volume has contributed novel insights into cardiovascular fluid dynamics in health and disease.


Figures

Figure 1
Figure 1
Data acquisition for 3D cine velocity acquisition using navigator gating and prospective ECG gating. Note that navigator control can also be replaced by other techniques for respiration estimation such as bellows or self-gating approaches. For each time-frame, flow compensated reference data and three velocity sensitive scans are acquired in an interleaved manner. Measurements are synchronized with the ECG cycle. The resulting raw data comprise information along all 3 spatial dimension, 3 velocity directions and time in the cardiac cycle.
Figure 2
Figure 2
Calculation of 3D PC-MRA for the thoracic aorta of a normal volunteer. A 3D cine velocity acquisition (A) is used to calculate absolute velocities |v| for each image voxel which are additionally weighted by the magnitude images for suppression of background signal. B: The resulting 3D angiogram can be displayed as maximum intensity projection (MIP) or as a transparent 3D iso-surface which can be combined with 3D flow visualization as shown in figures 3 and 4. (AAo: ascending aorta, DAo: descending aorta, PA: pulmonary artery)
Figure 3
Figure 3
3D visualization of normal peak systolic aortic blood flow using vector fields and color coding (A) and a series of systolic 3D streamlines (B). The gray shaded iso-surface represents the vessel lumen boundaries defined by the 3D PC-MR angiogram. Color coding reflects the local absolute velocity. Typical normal flow patterns such as flow acceleration near the aortic valve (A) or mild right-handed helical systolic flow in the ascending aorta (B) can be appreciated. See also additional file 1.
Figure 4
Figure 4
3D pathlines in a normal thoracic aorta illustrating the temporal evolution of blood flow at five different instants in systole. Pathlines were repetitively emitted at successive instants and originate from two emitter planes, one in the ascending aorta and one in the proximal descending aorta. Color coding reflects the local absolute velocity. See also additional file 2.
Figure 5
Figure 5
Demonstration of different particle trace visualization techniques of early diastolic left ventricular inflow in a healthy volunteer. A: Instantaneous streamlines traced at peak early diastolic inflow from a 20 × 20 plane across the mitral valve are used to visualize the directions of blood flow at this time point. B: short streamlines are here traced from multiple points on a 20 × 30 emitter plane oriented in the long axis of the left ventricle. C: Pathlines of virtual particles are traced from their positions at peak early diastolic inflow from a 20 × 20 emitter plane in the mitral valve and computed until end-systole, visualizing the flow paths though the left ventricle and into the ascending aorta. All particle traces are colored coded by velocity; blue represents low velocity, while turquoise represents higher velocity. A separately acquired balanced steady-state free precession three-chamber image provides anatomical orientation.
Figure 6
Figure 6
Pathline visualization of cardiac blood flow. Pathlines are traced from planes located at the mitral valve (red-yellow) and the tricuspid valve (blue-turquoise) at early diastolic ventricular inflow. A separately acquired balanced steady-state free precession three-chamber image provides anatomical orientation. See also additional file 3.
Figure 7
Figure 7
Characterization of blood flow in the human heart of a healthy volunteer during late diastolic inflow. Automatically detected vortex cores are shown as white isosurfaces and streamlines are traced around these isosurfaces to enhance the visualization. A (partial) vortex ring can be seen below the mitral valve (right in image) and the tricuspid valve (left in image). See also supplement additional file 4.
Figure 8
Figure 8
Flow analysis in a patient with an ascending aortic aneurysm (maximum diameter = 51 mm). 3D stream lines clearly show asymmetric aortic outflow and an accelerated flow channel along the outer aortic curvature and the onset of substantial helical flow during peak systole. The flow helix grows until late systole to occupy the entire ascending aorta and arch. Retrospective quantitative analysis in 4 planes (black lines) was used to evaluate the impact of the altered flow patterns on flow and wall parameters. The complex flow resulted in considerable variation of peak velocities along the aorta. The segmental distribution of wall shear stress (WSS, polar plots) in the ascending aorta (AAo, left) showed heterogeneity along the aortic circumference reflecting the pronounced asymmetry of flow and helix formation. Low WSS at the inner and left aortic curvature or also abnormally high WSS may be associated with altered endothelial function and indicate vascular regions at risk for further arterial remodeling. In contrast, flow in the descending aorta (DAo, right) was relatively normal with more homogenous segmental WWS distribution, i.e. high and more constant WSS along the entire lumen circumference. To view the temporal evolution of 3D aortic blood flow by time-resolved 3D pathlines see additional file 5. (PA: pulmonary artery).
Figure 9
Figure 9
Pathline visualization of blood flow during one cardiac cycle in the left ventricle (LV) of a healthy, 61 year old male at peak early LV filling (A), diastasis (B), peak atrial contraction (C), and peak systole (D). The pathlines are color coded to distinguish 4 different compartmental behaviors through the cardiac cycle: Direct Flow (green) enters the LV during diastole and leaves the LV during systole in the analyzed heart beat, Retained Inflow (yellow) enters the LV during diastole but does not leave during systole in the analyzed heart beat, Delayed Ejection Flow (blue) starts and resides inside the LV during diastole and leaves during systole, Residual Volume (red) resides in the LV through more than two cardiac cycles. See also additional file 6.
Figure 10
Figure 10
Streamline visualization of blood flow (left) and volume rendering of turbulence intensity (turbulent kinetic energy, TKE) (right) at peak systole in a patient with an aortic coarctation distal to the left subclavian artery. In addition to the coarctation, elevated values of turbulence intensity can be seen in the ascending aorta, resulting from a minimally obstructive sub-aortic valve membrane. A time-resolved volume rendering visualization of the TKE is provided in additional file 7.
Figure 11
Figure 11
Volume rendering visualization of turbulence intensity (turbulent kinetic energy, TKE) at mid-late systole in the left atrium of a patient with severe mitral regurgitation. A better comprehension of the 3D spatial extension of the TKE can be obtained from additional file 8.
Figure 12
Figure 12
3D flow visualization (A) and flow quantification (B) in a nine year old pediatric patient with aortic valve stenosis (aortic valve area = 1.2 cm2) and dilation of the ascending aorta (maximum diameter = 33 mm). Echocardiography demonstrated normal global cardiac function (ejection fraction EF = 72%) but substantial flow acceleration (peak velocity = 2.8 m/s) and an elevated pressure gradient (maximum pressure = 38 mmHg) at the level of the aortic valve. These findings were confirmed by retrospective quantitative analysis of the 4D PC-MRI data in an analysis plane above the aortic valve which revealed high systolic peak velocities (peak velocity = 3.2 m/s, max pressure gradient = 41 mmHg) but only very mild diastolic retrograde flow (gray arrow). 3D flow visualization using streamlines showed localized flow acceleration along the outer wall of the ascending aorta (solid white arrows) which developed into a vortex flow pattern (open arrows) occupying the shape of the aneurysm (AAo: ascending aorta, DAo: descending aorta).
Figure 13
Figure 13
Flow visualization of the heart and large vessels, viewed from several aspects, using streamlines to show the large scale intra-cavity flow structures in ventricular systole and diastole in a normal young volunteer. Color coding is based on the streamline origin. Iso-surface representation of 3D PC-MRA data derived from the same data set was used to generate the semi-transparent outer cavity boundary.
Figure 14
Figure 14
3D cine velocity acquisition in a patient with transposition of the great arteries corrected by an arterial switch procedure showing the post-surgical course of the pulmonary arteries, straddling the aorta. The 3D pathlines represent systolic flow from emitter planes in the ascending aorta (AAo) and main pulmonary artery (PA). Flow acceleration with peak velocities greater than 1.5 m/s in left (lPA) and right (rPA) pulmonary artery can be seen (white arrows) whereas the flow pattern in the aorta was normal. AAo: ascending aorta.

References

    1. Moran PR. A flow velocity zeugmatographic interlace for NMR imaging in humans. Magnetic resonance imaging. 1982;1(4):197–203. doi: 10.1016/0730-725X(82)90170-9. - DOI - PubMed
    1. Bryant DJ, Payne JA, Firmin DN, Longmore DB. Measurement of flow with NMR imaging using a gradient pulse and phase difference technique. Journal of computer assisted tomography. 1984;8(4):588–593. doi: 10.1097/00004728-198408000-00002. - DOI - PubMed
    1. Van Dijk P. Direct cardiac NMR imaging of heart wall and blood flow velocity. Journal of computer assisted tomography. 1984;171:429–436. doi: 10.1097/00004728-198406000-00012. - DOI - PubMed
    1. Nayler GL, Firmin DN, Longmore DB. Blood flow imaging by cine magnetic resonance. Journal of computer assisted tomography. 1986;10(5):715–722. doi: 10.1097/00004728-198609000-00001. - DOI - PubMed
    1. Pelc NJ, Herfkens RJ, Shimakawa A, Enzmann DR. Phase contrast cine magnetic resonance imaging. Magn Reson Q. 1991;7(4):229–254. - PubMed

Publication types