Signaling via the RIP2 adaptor protein in central nervous system-infiltrating dendritic cells promotes inflammation and autoimmunity
- PMID: 21236705
- PMCID: PMC3057380
- DOI: 10.1016/j.immuni.2010.12.015
Signaling via the RIP2 adaptor protein in central nervous system-infiltrating dendritic cells promotes inflammation and autoimmunity
Abstract
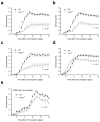
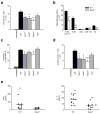
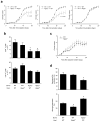
Peripheral peptidolgycan (PGN) is present within antigen-presenting cells in the central nervous system (CNS) of multiple sclerosis (MS) patients, possibly playing a role in neuroinflammation. Accordingly, PGN is linked with disease progression in the animal model of MS, experimental autoimmune encephalomyelitis (EAE), but the role of specific PGN-sensing proteins is unknown. Here we report that the progression of EAE was dependent on the intracellular PGN sensors NOD1 and NOD2 and their common downstream adaptor molecule, receptor interacting protein 2 (RIP2; also known as RIPK2 and RICK). We found that RIP2, but not toll-like receptor 2 (TLR2), played a critical role in the activation of CNS-infiltrating dendritic cells. Our results suggest that PGN in the CNS is involved in the pathogenesis of EAE through the activation of infiltrating dendritic cells via NOD1-, NOD2-, and RIP2-mediated pathways.
Copyright © 2011 Elsevier Inc. All rights reserved.
Figures


Comment in
-
CNS autoimmune inflammation: RICK must NOD!Immunity. 2011 Jan 28;34(1):3-5. doi: 10.1016/j.immuni.2011.01.010. Immunity. 2011. PMID: 21272781 Free PMC article.
-
Inflammation: An innate signal for CNS disease.Nat Rev Immunol. 2011 Mar;11(3):162. doi: 10.1038/nri2950. Nat Rev Immunol. 2011. PMID: 21462391 No abstract available.
Similar articles
-
The kinase activity of Rip2 determines its stability and consequently Nod1- and Nod2-mediated immune responses.J Biol Chem. 2009 Jul 17;284(29):19183-8. doi: 10.1074/jbc.M109.006353. Epub 2009 May 27. J Biol Chem. 2009. PMID: 19473975 Free PMC article.
-
LRRK2 enhances Nod1/2-mediated inflammatory cytokine production by promoting Rip2 phosphorylation.Protein Cell. 2017 Jan;8(1):55-66. doi: 10.1007/s13238-016-0326-x. Epub 2016 Nov 9. Protein Cell. 2017. PMID: 27830463 Free PMC article.
-
Retinal astrocytes pretreated with NOD2 and TLR2 ligands activate uveitogenic T cells.PLoS One. 2012;7(7):e40510. doi: 10.1371/journal.pone.0040510. Epub 2012 Jul 10. PLoS One. 2012. PMID: 22808176 Free PMC article.
-
The Nodosome: Nod1 and Nod2 control bacterial infections and inflammation.Semin Immunopathol. 2007 Sep;29(3):289-301. doi: 10.1007/s00281-007-0083-2. Epub 2007 Aug 10. Semin Immunopathol. 2007. PMID: 17690884 Review.
-
Nucleotide-binding oligomerization domain containing 2: structure, function, and diseases.Semin Arthritis Rheum. 2013 Aug;43(1):125-30. doi: 10.1016/j.semarthrit.2012.12.005. Epub 2013 Jan 24. Semin Arthritis Rheum. 2013. PMID: 23352252 Review.
Cited by
-
CARD3 Promotes Cerebral Ischemia-Reperfusion Injury Via Activation of TAK1.J Am Heart Assoc. 2020 May 5;9(9):e014920. doi: 10.1161/JAHA.119.014920. Epub 2020 Apr 30. J Am Heart Assoc. 2020. PMID: 32349637 Free PMC article.
-
Nucleotide-binding oligomerization domain (NOD) signaling defects and cell death susceptibility cannot be uncoupled in X-linked inhibitor of apoptosis (XIAP)-driven inflammatory disease.J Biol Chem. 2017 Jun 9;292(23):9666-9679. doi: 10.1074/jbc.M117.781500. Epub 2017 Apr 12. J Biol Chem. 2017. PMID: 28404814 Free PMC article.
-
OTUD1 ameliorates cerebral ischemic injury through inhibiting inflammation by disrupting K63-linked deubiquitination of RIP2.J Neuroinflammation. 2023 Nov 27;20(1):281. doi: 10.1186/s12974-023-02968-7. J Neuroinflammation. 2023. PMID: 38012669 Free PMC article.
-
Ripks and Neuroinflammation.Mol Neurobiol. 2024 Sep;61(9):6771-6787. doi: 10.1007/s12035-024-03981-4. Epub 2024 Feb 13. Mol Neurobiol. 2024. PMID: 38349514 Review.
-
TLR2 and TLR4 in autoimmune diseases: a comprehensive review.Clin Rev Allergy Immunol. 2014 Oct;47(2):136-47. doi: 10.1007/s12016-013-8402-y. Clin Rev Allergy Immunol. 2014. PMID: 24352680 Review.
References
-
- Bailey SL, Schreiner B, McMahon EJ, Miller SD. CNS myeloid DCs presenting endogenous myelin peptides ‘preferentially’ polarize CD4+ T(H)-17 cells in relapsing EAE. Nat Immunol. 2007;8:172–180. - PubMed
-
- Buljevac D, Flach HZ, Hop WC, Hijdra D, Laman JD, Savelkoul HF, van Der Meche FG, van Doorn PA, Hintzen RQ. Prospective study on the relationship between infections and multiple sclerosis exacerbations. Brain. 2002;125:952–960. - PubMed
-
- Buljevac D, Verkooyen RP, Jacobs BC, Hop W, van der Zwaan LA, van Doorn PA, Hintzen RQ. Chlamydia pneumoniae and the risk for exacerbation in multiple sclerosis patients. Ann Neurol. 2003;54:828–831. - PubMed
-
- Chamaillard M, Hashimoto M, Horie Y, Masumoto J, Qiu S, Saab L, Ogura Y, Kawasaki A, Fukase K, Kusumoto S, et al. An essential role for NOD1 in host recognition of bacterial peptidoglycan containing diaminopimelic acid. Nat Immunol. 2003;4:702–707. - PubMed
Publication types
MeSH terms
Substances
Grants and funding
LinkOut - more resources
Full Text Sources
Other Literature Sources
Medical
Molecular Biology Databases

