. 2011 Jan;34(1):2-14.
doi: 10.1016/j.jmpt.2010.11.008.

Evaluating the relationship among cavitation, zygapophyseal joint gapping, and spinal manipulation: an exploratory case series

Affiliations

Evaluating the relationship among cavitation, zygapophyseal joint gapping, and spinal manipulation: an exploratory case series

Gregory D Cramer et al. J Manipulative Physiol Ther. 2011 Jan.

Abstract

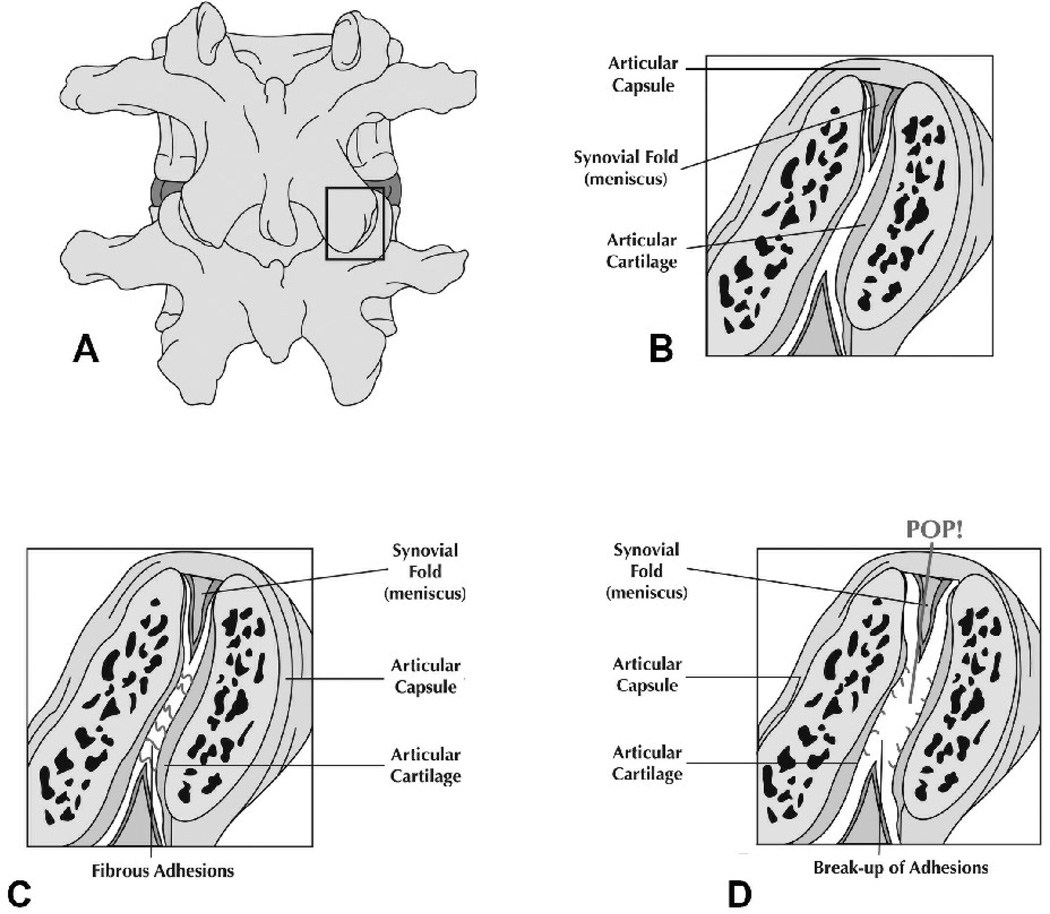
Objective: This project determined the feasibility of conducting larger studies assessing the relationship between cavitation and zygapophyseal (Z) joint gapping following spinal manipulative therapy (SMT).

Methods: Five healthy volunteers (average age, 25.4 years) were screened and examined against inclusion and exclusion criteria. High-signal magnetic resonance imaging (MRI) markers were fixed to T12, L3, and S1 spinous processes. Scout images were taken to verify the location of the markers. Axial images of the L4/L5 and L5/S1 levels were obtained in the neutral supine position. Following the first MRI, accelerometers were placed over the same spinous processes; and recordings were made from them during side-posture positioning and SMT. The accelerometers were removed, and each subject was scanned in side-posture. The greatest central anterior to posterior Z joint spaces (gap) were measured from the first and second MRI scans. Values obtained from the first scan were subtracted from those of the second, with a positive result indicating an increase in gapping following SMT (positive gapping difference). Gapping difference was compared between the up-side (SMT) joints vs the down-side (non-SMT) joints and between up-side cavitation vs up-side noncavitation joints.

Results: Greater gapping was found in Z joints that received SMT (0.5 ± 0.6 mm) vs non-SMT joints (-0.2 ± 0.6 mm), and vertebral segments that cavitated gapped more than those that did not cavitate (0.8 ± 0.7 vs 0.4 ± 0.5 mm).

Conclusions: A future clinical study is quite feasible. Forty subjects (30 in an SMT group and 10 in a control group) would be needed for appropriate power (0.90).


Figures

Figure 1
Figure 1
Flowchart showing a model of putative beneficial anatomical/biomechanical and neurological effects of spinal manipulation. Other putative effects (e.g., immunological effects) are not included in this flowchart.
Figure 2
Figure 2
Theoretical mechanism of cavitation (joint sound) production. A = Posterior view of zygapophysial (Z) joints (right Z joint in box). B = Parasagittal section of Z joint showing Z joint synovial folds. C = Z joint adhesions developing in hypomobile joint. D = Therapeutic gapping (separation) of Z joint articulating facets breaking up adhesions while a cavitation (pop) is created.
Figure 3
Figure 3
Taping of MRI high signal markers and the 1st (neutral position) MRI scan. A: Close-up of an MRI high signal marker fixed to the skin tape. B: A high signal marker being taped across the L3 SP. The markers were taped in a horizontal plane across the spinous processes (SPs) of T12, L3, and S1. C: MRI scanning in the neutral position with the high signal markers in place (markers not seen). D: Sagittal scout view MRI showing placement of 2 of the 3 high signal markers. The markers (white arrows) are the distinct, but small, high signal (white) structures visible to the right of (posterior to) the subcutaneous adipose tissue, which has a very high signal along the right side of the image. The intended placement of the high signal markers was directly posterior to the spinous processes (SPs) of T12, L3, and S1. The lower black arrow indicates the SP of L3 and the black arrow at the top of the figure indicates the SP of T12. Consequently, a slight adjustment was made when placing the accelerometer over the SP of L3 (i.e., the accelerometer was placed 1 cm superior to the skin indentation made by the high signal marker). The most inferior (S1) high signal marker was visible on the adjacent image (5 cm lateral) to the image shown in this figure.
Figure 4
Figure 4
Location and taping of accelerometers, spinal manipulation while recording from accelerometers, and 2nd (side-posture position) MRI scan. Once the correct location of the SPs were verified from the MRI scans showing the high signal markers, accelerometers were taped over the SPs of T12, L3, and S1. A: Illustration showing placement of 3 accelerometers. B: Taping the 3 accelerometers on the SPs. C: Close-up of an accelerometer (approximately 1 cm). D: Spinal manipulation given while recording from the 3 accelerometers. E: Second MRI scan, this time in the side-posture position to maximize Z joint gapping following SMT (accelerometers removed following SMT).
Figure 5
Figure 5
Examples of recordings from the accelerometers. A: Recording showing a cavitation. B: The time scale of the cavitation is expanded to show when each accelerometer first recorded a vibration. This information was used in an algorithm with previously measured distances between the accelerometers to determine the location of the cavitation with respect to the 3 accelerometers. This distance information was then compared with distances between the SPs and Z joints measured from the MRI scans to determine the Z joint(s) that cavitated (cross reference with Table 3). This cavitation occurred at the L4/L5 vertebral level.
Figure 6
Figure 6
The central anterior to posterior (A-P) distance between the superior and inferior articular processes of the Z joints. A: Cartoon drawing showing A-P distance measurement. B: A-P measurement labeled on an MRI scan. This distance was measured for the left and right L4/L5 and L5/S1 Z joints from each subject’s first and second MRI scans.
Figure 7
Figure 7
Gapping Differences of SMT (up-side) vs. non-SMT (down-side) Z joints. The Gapping Difference for each Z joint was calculated as: (A-P measurement from 2nd MRI) – (A-P measurement from 1st MRI). A positive value indicated an increase in gapping following SMT. The SMT (up-side) joints showed more gapping than the non-SMT (down-side) joints. Notice the scale on the Y-axis includes negative values to accommodate the negative gapping difference of the down-side joints.
Figure 8
Figure 8
Gapping Differences of SMT Z joints (i.e., up-side joints during SMT) that cavitated vs. those that did not cavitate. The SMT (up-side) joints that cavitated showed more gapping than the SMT joints that did not cavitate.

References

    1. Cramer GD, Gregerson DM, Knudsen JT, Hubbard BB, Ustas LM, Cantu JA. The effects of side-posture positioning and spinal adjusting on the lumbar Z joints: a randomized controlled trial with sixty-four subjects. Spine (Phila Pa 1976) 2002;27(22):2459–2466. - PubMed
    1. Triano JJ. Interaction of spinal biomechanics and physiology. In: Haldeman S, editor. Principles and practice of chiropractic. 2nd ed. East Norwalk, Conn: Appleton & Lange; 1992. pp. 225–257.
    1. Mooney V, Robertson J. The facet syndrome. Clin Orthop Res. 1976;115:149–156. - PubMed
    1. Janse J. In: Principles and practice of chiropractic: an anthology. Hildebrandt RW, editor. Wheaton: Kjellberg & Sons; 1976. p. 326.
    1. Pickar JG. An in vivo preparation for investigating neural responses to controlled loading of a lumbar vertebra in the anesthetized cat. J Neurosci Meth. 1999;89:87–96. - PubMed

Publication types