

doi: 10.1016/j.clinimag.2010.03.001.
PET/CT artifacts
Affiliations
- PMID: 21237418
- PMCID: PMC4277262
- DOI: 10.1016/j.clinimag.2010.03.001
Item in Clipboard
PET/CT artifacts
Clin Imaging.
2011 Jan-Feb.
Abstract
There are several artifacts encountered in positron emission tomography/computed tomographic (PET/CT) imaging, including attenuation correction (AC) artifacts associated with using CT for AC. Several artifacts can mimic a 2-deoxy-2-[18F] fluoro-d-glucose (FDG) avid malignant lesions and therefore recognition of these artifacts is clinically relevant. Our goal was to identify and characterize these artifacts and also discuss some protocol variables that may affect image quality in PET/CT.
Copyright © 2011 Elsevier Inc. All rights reserved.
Figures

The transformations in current CT-based attenuation correction algorithms used to convert Hounsfield units into 511 keV linear attenuation values for attenuation correction in PET. The threshold model (solid line) is described in (5) and the mixing model (dashed line) is described in (6). Both perform well in transforming bone and soft tissue values.

Coronal PET image (a) shows a focal area of apparent FDG uptake in the left axilla that would be suspicious for a lymph node (arrow). Inspection of the axial CT, fused PET/CT and AC PET images (b–d) show that the area of FDG activity to be linear and in the area of the IV contrast in the left subclavian vein (arrows). The non-AC PET image (e) proves that the apparent FDG activity is an AC artifact only seen on AC PET and AC PET/CT fused images.

All images except the axial non-AC PET image (a–d) show a focal area of apparent FDG activity in the area of the right brachiocephalic vein (arrow). Inspection of the non-AC PET image (e) shows no FDG activity proving this focal area of otherwise suspicious FDG activity to be an AC artifact.

Coronal PET image (a) shows apparent nodal spread (arrows) adjacent to and to the left of a primary squamous cell carcinoma of the larynx (arrowhead). Axial CT and fused PET/CT images (b,c) show the apparent focal area of intense FDG uptake to correlate to part of an area of IV contrast in the left subclavian area (arrow). Although there is apparent FDG activity on the AC PET image (d), the non-AC PET image (e) shows no FDG activity in this area compatible with a focal IV contrast AC artifact.

Axial CT (a,d), fused PET/CT with AC PET (b,e), and fused PET/CT with non-AC PET (c,f) images show two areas of dense contrast remaining in the bowel after an upper GI performed with barium (arrows). The fused PET/CT with non-AC PET shows no FDG activity in the artifactual areas that appear to have very intense FDG uptake on the fused PET/CT with AC PET. This is a good example of an oral contrast AC artifact.

Depiction of a software-based modified AC algorithm applied to oral-contrast enhanced studies. True bone voxels in the CT images are segmented from oral-contrast enhanced voxels using a region-growing algorithm, followed by the replacement of the enhanced voxels with the HU for water. Finally, the modified CT images can then be transformed in the usual way appropriate for bone and soft tissue (e.g. using one of the methods in Figure 1).

Coronal CT image showing an area of high attenuation material in the stomach (arrow, close to ~3000 HU). Non-AC coronal PET image shows no significant activity (arrow). Using the standard AC algorithm, there is a focal area of apparent FDG activity corresponding to the area of high attenuation material (AC, arrow). Using the modified AC algorithm of Figure 6, this area is correctly displayed without focal FDG activity (Modified AC).

Coronal PET, axial CT and fused PET/CT images (a–c) show a focal area of intense FDG accumulation (arrows) that appears to correlate to the area of a chemotherapy port in the right upper chest wall. Although present on the axial AC PET image (d), the non-AC image (e) shows correctly that this area is an AC artifact due to the high attenuation composition of the material in the port.

Coronal PET (a) demonstrates apparent areas of intense FDG uptake (arrows) that correlate to a metallic left hip prosthesis on CT and fused PET/CT images (b–c). AC PET (d) shows a focal area of apparent FDG activity lateral to the prosthesis, but inspection of the non-AC image (e) shows the area in question to be an AC artifact. This could easily be mistaken as inflammation, loosening or infection around the prosthesis.

Coronal PET (a) demonstrates areas of intense FDG accumulation in the area of the oral cavity (arrow). Axial CT and fused PET/CT with AC PET (b,c) show the apparent uptake to correlate to areas of streak artifact on CT from dental fillings. Non-AC PET (d) shows areas of photopenia proving these areas on the attenuation corrected coronal PET to be an artifact generated during the attenuation correction process.

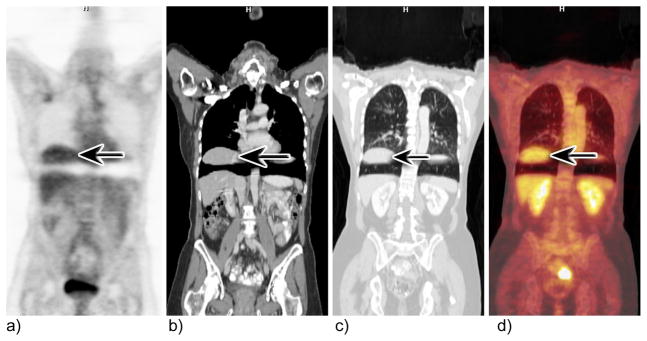
Coronal AC PET image (a) shows a focal area of intense FDG uptake in the subcarinal area (arrow). CT and Fused PET/CT images (b,c) show the area of uptake to correspond to a calcified subcarinal lymph node (arrows). The non-AC PET image (e) shows no evidence of FDG activity in the suspected area proving the area to be an AC artifact.
Coronal PET, CT and PET/CT images (a–d) show severe displacement and apparent detachment of a large portion of the liver (arrows) from using tidal respiration breathing protocol during the CT acquisition.

Coronal PET, CT and fused PET/CT images and axial fused PET/CT image (ad) from a combined PET/CT exam show an area of FDG uptake (arrows) adjacent to a small diaphragmatic breathing artifact in which the top of the liver appears to be displaced into the thorax. Although easily overlooked because of its proximity to the artifact, this abnormality was eventually biopsied because it did not resolve over time. The biopsy was positive for bronchioloalveloar cell carcinoma.

Coronal PET images (a–c) show infiltration of FDG dose in the left forearm and subsequent uptake into the lymphatics (arrows) as well as several axillary and mediastinal lymph nodes (arrowhead). Although the FDG activity in the nodes was secondary to the infiltrated dose, the patient was brought back for a repeat scan two weeks later because of the inability to differentiate between FDG taken up by the lymphatics versus malignant lymph nodes. The follow-up scan was negative.

Coronal PET images (a–c) from 3 patients of varying weight shows severe degradation of image quality in a patient weighing 142 kg (c) compared to patients weighing 61 (a) and 103 (b) kg acquired with similar imaging protocols and on the same scanner.

Coronal (b,d) and axial (a,c) CT images in the same patient with arms up and arms down show significant beam hardening artifact and image quality degradation with arms up compared to that of arms down.

Coronal PET/CT (a) and axial CT and fused PET/CT (b,c) images in a patient with an elevated blood glucose level who was given IV insulin in an attempt to bring blood glucose levels down. Note the multiple linear areas of intense FDG accumulation corresponding to areas of muscle (arrows). This is because insulin has the same effect on FDG that it does on glucose; it facilitates the entry of both into muscle and fat cells.
References
-
- Cook GJ, Fogelman I, Maisey MN. Normal physiological and benign pathological variants of 18-fluoro-2-deoxyglucose positron-emission tomography scanning: potential for error in interpretation. Semin Nucl Med. 1996 Oct;26(4):308–14. - PubMed
-
- Puthenpurayil BT, Meltzer CC. AUR 2002. 2002. Photopenic defects in FDG PET scanning.
-
- Carney JPTD. CT-based attenuation correction for PET-CT scanners. In: von Schultess G, editor. CLINICAL PET, PET-CT and SPECT/CT: Combined Anatomic-Molecular Imaging. Lippincott, Williams and Wilkins; 2003. pp. 46–58.
-
- Kotzerke J, Guhlmann A, Moog F, Frickhofen N, Reske SN. Role of attenuation correction for fluorine-18 fluorodeoxyglucose positron emission tomography in the primary staging of malignant lymphoma. Eur J Nucl Med. 1999 Jan;26(1):31–8. - PubMed
-
- Kinahan PE, Townsend DW, Beyer T, Sashin D. Attenuation correction for a combined 3D PET/CT scanner. Med Phys. 1998 Oct;25(10):2046–53. - PubMed
