. 2011 May;34(3):247-57.
doi: 10.1016/j.cimid.2010.12.002. Epub 2011 Jan 14.

Transient or persistent norovirus infection does not alter the pathology of Salmonella typhimurium induced intestinal inflammation and fibrosis in mice

Affiliations

Transient or persistent norovirus infection does not alter the pathology of Salmonella typhimurium induced intestinal inflammation and fibrosis in mice

Peter D R Higgins et al. Comp Immunol Microbiol Infect Dis. 2011 May.

Abstract

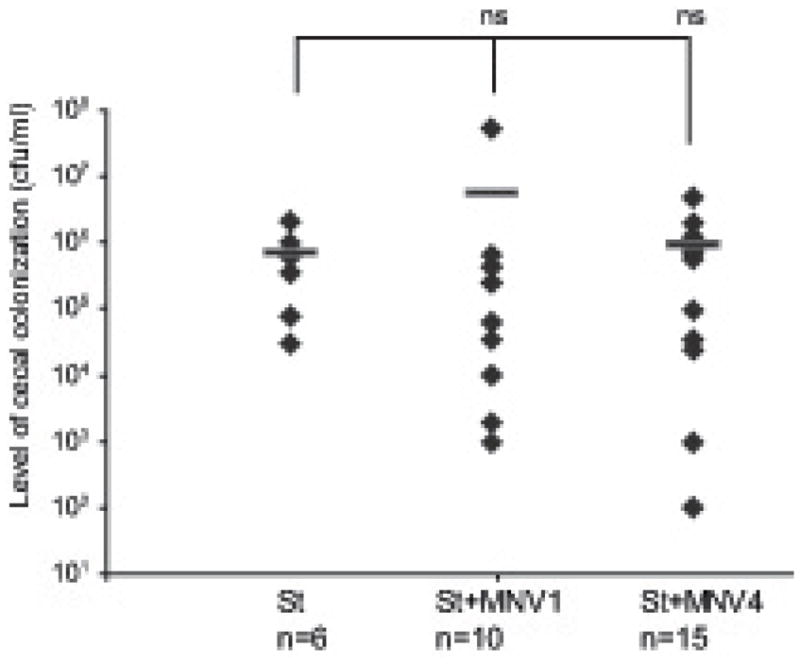
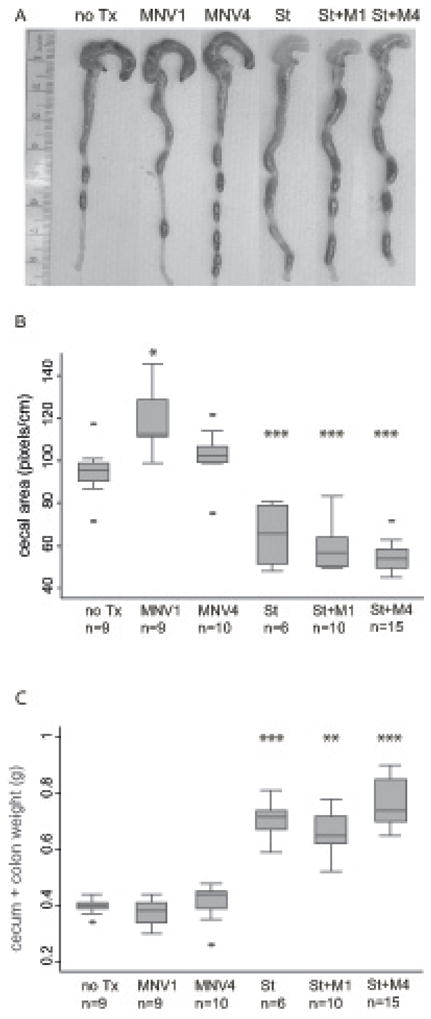
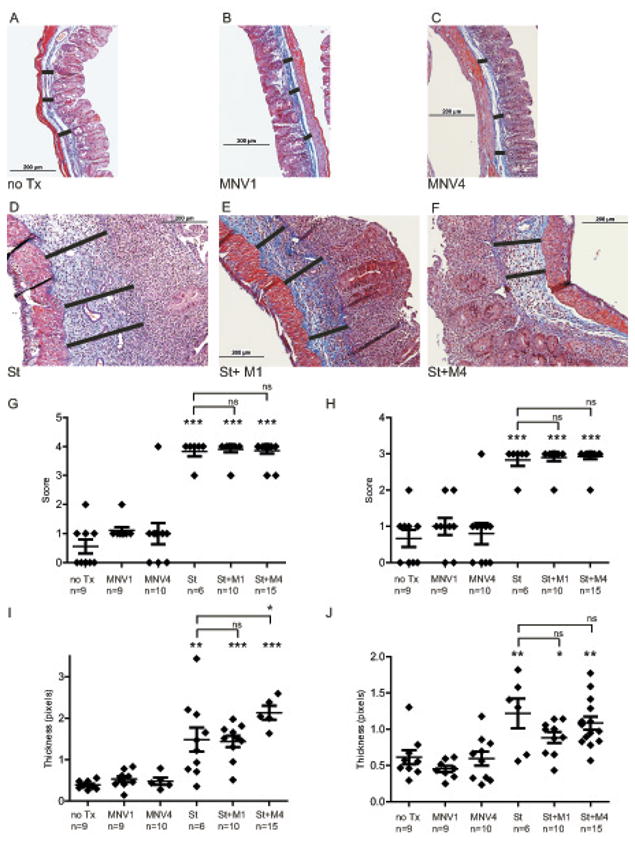
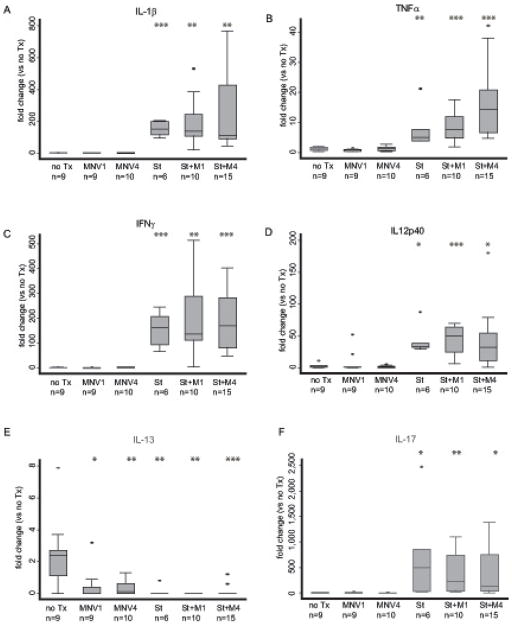
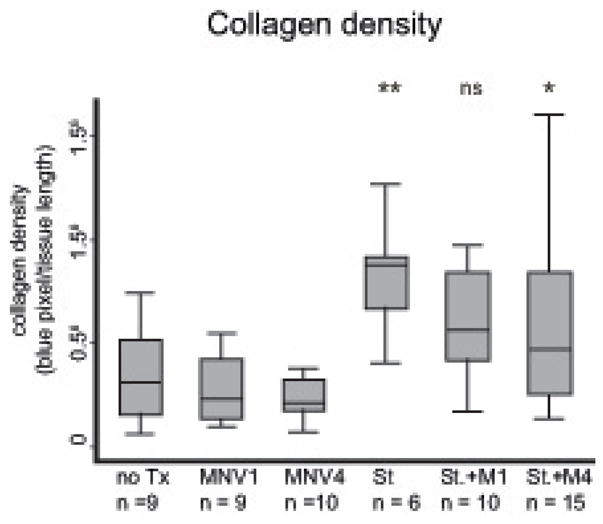
Murine noroviruses (MNV) are currently the most prevalent viruses infecting mouse research colonies. Concurrent infection of research mice with these viruses can dramatically alter the experimental outcome in some research models, but not others. In this report, we investigated the effect of MNV1 and MNV4 on a murine model of intestinal inflammation and fibrosis induced by Salmonella typhimurium infection in C57BL/6 mice. Subsequent co-infection of these mice with MNV1 or MNV4 did not lead to major changes in histopathology, the inflammatory response, or the fibrotic response. Thus, MNV does not substantially alter all gastrointestinal research models, highlighting the importance of investigating potential alterations in the research outcome by MNV on an individual basis. We hypothesize that this is particularly important in cases of research models that use immunocompromised mice, which could be more sensitive to MNV infection-induced changes.


Figures

Figure 1
Figure 1. S. typhimurium colonization of the mouse cecum in the presence or absence of MNV1 or MNV4
The S. typhimurium loads were determined by plating 100 μl of cecal contents onto LB/streptomycin plates. S. typhimurium colonization is expressed as cfu/ml volume of cecal contents and the mean cfu of each experimental group is indicated by a horizontal line. Each diamond represents the data from an individual animal and the total number (n) of animals per experimental group is indicated. St = S. typhimurium infected animals; St + MNV1 = S. typhimurium and MNV1 co- infected animals; St + MNV4 = S. typhimurium and MNV4 co-infected animals; ns = not statistically significant (p≥0.05) compared to no St.
Figure 2
Figure 2. Gross pathology of the cecum and distal colon
(A) Representative photograph of the cecum and colon of uninfected mice (no Tx) compared to MNV1 infected (MNV1), MNV4 infected (MNV4), S. typhimurium infected (St), S. typhimurium and MNV1 co-infected (St + M1), and S. typhimurium and MNV4 co- infected (St + M4) animal. A 1 cm ruler is shown as reference. (B). Cecal area (in pixels) from animals in each experimental group described in A were calculated using NIH ImageJ and normalized against a 1 cm reference ruler. (C) Combined cecum and colon tissue weight was determined after the cecum and colon was longitudinally cut, rinsed of fecal contents, and blotted dry. For B) and C), the horizontal line in the box plot represents the median, the upper and lower box boundaries represent the interquartile range, and the ends of the whiskers represent the 5% and 95% confidence limits. Extreme values (> 2 standard deviations) are represented as individual dots. n = number of animals per experimental group. * p < 0.05, ** p < 0.01, *** p < 0.001 compared to no Tx.
Figure 3
Figure 3. Histopathology and submucosal thickness of the cecum
Representative trichrome stained sections of mouse cecum from uninfected (A) compared to MNV1 infected (B), MNV4 infected (C), S. typhimurium infected (D), S. typhimurium and MNV1 co-infected (E), and S. typhimurium and MNV4 co-infected (F) mice. Photomicrographs were taken at 100× magnification with a 200 μM scale. (G) Inflammatory scoring (blinded) of cecal sections using the 0 to 4 point Wirtz scale as described in Materials and Methods. (H) Fibrosis scoring (blinded) of cecal sections was determined from trichrome stained cecal sections: (0) no fibrosis, (1) mild focal fibrosis, (2) moderate fibrosis, and (3) severe fibrosis. (I) Submucosal expansion was measured from 3 reference points (black bars in Fig.A-F) for each tissue section and averaged to determine submucosal thickness. (J) Muscularis propria thickness was measured from 3 reference points from each tissue section and averaged to determine the extent of muscularis propria hypertrophy. In graphs G-J diamonds represent the average thickness of cecal submucosa from individual animals while the horizontal bar represents the mean submucosal thickness for each experimental group. Results are from three independent animal experiments. n= number of animals per experimental group, not significant (ns) = p≥0.05, * p < 0.05, ** p < 0.01, *** p < 0.001 compared to no Tx.
Figure 4
Figure 4. Th1, Th2, and Th17 cytokine responses in the mouse cecum
Cytokine expression of (A) IL-1β, (B) TNFα, (C) IFNγ, (D) IL-12p40, IL-13 (E) and IL-17 (F) in the cecum of uninfected mice (no Tx), MNV1 infected (MNV1), MNV4 infected (MNV4), S. typhimurium infected (St), S. typhimurium and MNV1 co-infected (St+M1), and S. typhimurium and MNV4 co-infected (St+M4) mice were determined by qRT-PCR. Cytokine expression was normalized to GAPDH expression and compared to expression in the no Tx group using the the ΔΔCT method [37]. Fold-change (RQ) was calculated (RQ=2-ΔΔCt) and graphed. The RQ is represented by the horizontal line in the box plot and the ends of the whiskers represent RQ-min and RQ-max limits, based on the standard error (SEM) of the individual ΔCt (2(– ΔCt ± SEM) / 2(– ΔCt reference)). Outliers are defined as exceeding two SEM from the RQ and are represented as individual dots. Results are from three independent animal experiments. n = number of animals per experimental group, ** p < 0.01, *** p < 0.001 compared to no Tx.
Figure 5
Figure 5. Collagen deposition in the cecum
Collagen density was determined from digital images of an entire cross-section of cecal tissue from each animal and normalized to the length of tissue. Results are from three independent animal experiments. n = number of animals per experimental group, not significant (ns) = p≥0.05, * p < 0.05, ** p < 0.01, *** p < 0.001 compared to no Tx.

Similar articles

Cited by

References

    1. Mead PS, et al. Food-related illness and death in the United States. Emerg Infect Dis. 1999;5(5):607–25. - PMC - PubMed
    1. Glass RI, Parashar UD, Estes MK. Norovirus gastroenteritis. N Engl J Med. 2009;361(18):1776–85. - PMC - PubMed
    1. Siebenga JJ, et al. Norovirus illness is a global problem: emergence and spread of norovirus GII.4 variants, 2001–2007. J Infect Dis. 2009;200(5):802–12. - PubMed
    1. Karst SM, et al. STAT1-dependent innate immunity to a Norwalk-like virus. Science. 2003;299(5612):1575–8. - PubMed
    1. Thackray LB, et al. Murine noroviruses comprising a single genogroup exhibit biological diversity despite limited sequence divergence. J Virol. 2007;81(19):10460–73. - PMC - PubMed

Publication types

MeSH terms