. 2011 Jun;28(6):1893-900.
doi: 10.1093/molbev/msr010. Epub 2011 Jan 13.

Towards a more nuanced understanding of the relationship between sex-biased gene expression and rates of protein-coding sequence evolution

Affiliations

Towards a more nuanced understanding of the relationship between sex-biased gene expression and rates of protein-coding sequence evolution

Richard P Meisel. Mol Biol Evol. 2011 Jun.

Abstract

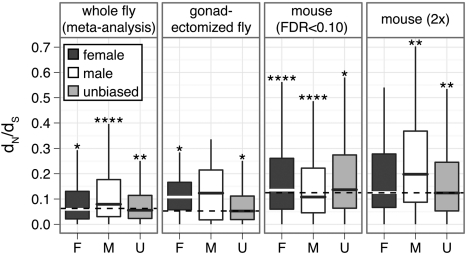
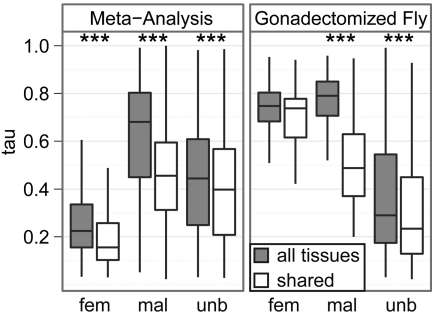
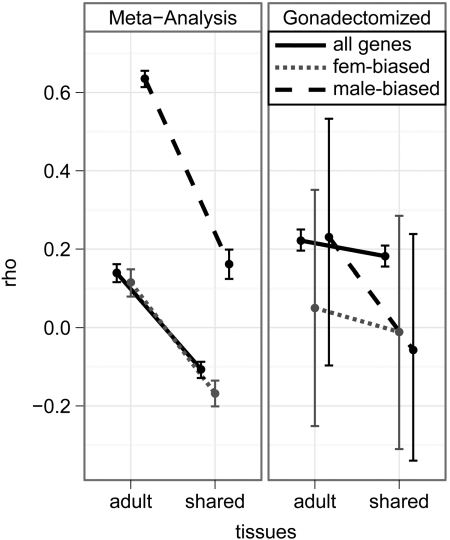
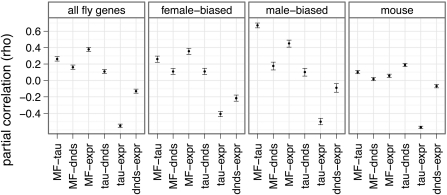
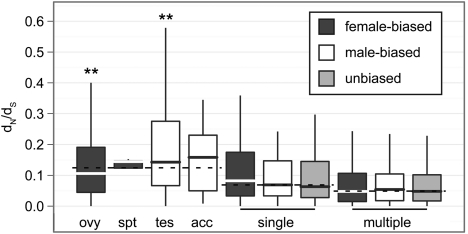
Genes that are differentially expressed between the sexes (sex-biased genes) are among the fastest evolving genes in animal genomes. The majority of sex-biased expression is attributable to genes that are primarily expressed in sex-limited reproductive tissues, and these reproductive genes are often rapidly evolving because of intra- and intersexual selection pressures. Additionally, studies of multiple taxa have revealed that genes with sex-biased expression are also expressed in a limited number of tissues. This is worth noting because narrowly expressed genes are known to evolve faster than broadly expressed genes. Therefore, it is not clear whether sex-biased genes are rapidly evolving because they have sexually dimorphic expression, because they are expressed in sex-limited reproductive tissues, or because they are narrowly expressed. To determine the extend to which other confounding variables can explain the rapid evolution of sex-biased genes, I analyzed the rates of evolution of sex-biased genes in Drosophila melanogaster and Mus musculus in light of tissue-specific measures of expression. I find that genes with sex-biased expression in somatic tissues shared by both sexes are often evolving faster than non-sex-biased genes, but this is best explained by the narrow expression profiles of sex-biased genes. Sex-biased genes in sex-limited tissues in D. melanogaster, however, evolve faster than other narrowly expressed genes. Therefore, the rapid evolution of sex-biased genes is limited only to those genes primarily expressed in sex-limited reproductive tissues.


Figures

F<sc>IG</sc> 1
FIG 1
Box plots show the distribution of dN/dS for female-biased (dark gray), male-biased (white), and unbiased (light gray) genes, with outliers omitted (boxes extend from the first to third quartile, with the midline indicating the median). Genes were assigned to sex-biased classes using an FDR cut off of 0.10 and the following data sets: meta-analysis of D. melanogaster experiments, gonadectomized flies, and mouse data. The mouse data were also analyzed with a 2-fold cut off to assign genes as sex-baised. The median dN/dS value across all genes within each panel is indicated by a dashed line. Asterisks indicate a significant difference in dN/dS between a subset of genes and the rest of the panel in a Mann–Whitney test (*P<10−2, **P<10−4, ****P<10−8).
F<sc>IG</sc> 2
FIG 2
Box plots show the distributions of τ for female-biased (fem), male-biased (mal), and unbiased (unb) D. melanogaster genes (outliers have been omitted); larger τ indicates more tissue specificity. Each box extends from the first to the third quartile, with the line in the middle of the box indicating the median. Tissue specificity was calculated using all tissues (gray) or somatic tissues shared by both sexes (white). Sex-biased genes were determined from the meta-analysis of multiple data sets (left) or gonadectomized flies (right). Asterisks indicate significant differences in τ when measured in all tissues compared with when measured in somatic tissues shared by both sexes using a Mann–Whitney test (***P<10−4).
F<sc>IG</sc> 3
FIG 3
Plots show the point estimate of the correlation coefficient (ρ) between |log(M/F| and tissue specificity (τ) and the 95% CI of the estimate for D. melanogaster genes. M/F was estimated using the meta-analysis of multiple data sets (left) or gonadectomized flies (right). Estimates of τ were calculated using all adult tissues (adult) or shared somatic tissues (shared). Correlations were calculated using all genes (black), female-biased genes (gray, short dashes), and male-biased genes (black, long dashes).
F<sc>IG</sc> 4
FIG 4
Point estimates of the partial correlation coefficient (ρ) between |log(M/F)| (MF), τ (tau), dN/dS (dnds), and expression level (expr) are indicated with filled circles, along with their 95% CI (error bars). Correlations were estimated using all D. melanogaster genes, D. melanogaster female-biased genes, D. melanogaster male-biased genes, or data from mouse. For the D. melanogaster analysis, M/F was estimated using the meta-analysis, τ was calculated using all adult tissues, and dN/dS was calculated along the branch leading to D. melanogaster after the split with the D. simulans lineage. For the mouse analysis, genes expressed in at least one of four tissues were used to estimate M/F from the microarray data.
F<sc>IG</sc> 5
FIG 5
Box plots show the distribution of dN/dS for female-biased (dark gray), male-biased (white), and unbiased (light gray) D. melanogaster genes, with outliers omitted (boxes extend from the first to third quartile, with the midline indicating the median). Genes were divided into those that are expressed in a single sex-limited tissue (ovy = ovary, spt = spermatheca, tes = testis, and acc = accessory gland), those that are expressed in a single shared somatic tissue (single), and those that are expressed in multiple tissues (multiple). The median dN/dS value across all genes within a group of genes is indicated by a dashed line. Asterisks indicate a significant difference in dN/dS between a subset of genes and the rest of the group in a Mann–Whitney test (**P < 10 − 4).

References

    1. Arbeitman MN, Fleming AA, Siegal ML, Null BH, Baker BS. A genomic analysis of Drosophila somatic sexual differentiation and its regulation. Development. 2004;131:2007–2021. - PubMed
    1. Arbeitman MN, Furlong EEM, Imam F, Johnson E, Null BH, Baker BS, Krasnow MA, Scott MP, Davis RW, White KP. Gene expression during the life cycle of Drosophila melanogaster. Science. 2002;297:2270–2275. - PubMed
    1. Ayroles JF, Carbone MA, Stone EA, et al. (11 co-authors) Systems genetics of complex traits in. Drosophila melanogaster. Nat Genet. 2009;41:299–307. - PMC - PubMed
    1. Baines JF, Sawyer SA, Hartl DL, Parsch J. Effects of X-linkage and sex-biased gene expression on the rate of adaptive protein evolution in. Drosophila. Mol Biol Evol. 2008;25:1639–1650. - PMC - PubMed
    1. Begun DJ, Lindfors HA. Rapid evolution of genomic Acp complement in the melanogaster subgroup of. Drosophila. Mol Biol Evol. 2005;22:2010–2021. - PubMed

Publication types

LinkOut - more resources