. 2011 Feb 15;186(4):2201-9.
doi: 10.4049/jimmunol.1002223. Epub 2011 Jan 14.

A role for autophagic protein beclin 1 early in lymphocyte development

Affiliations

A role for autophagic protein beclin 1 early in lymphocyte development

Ivica Arsov et al. J Immunol. .

Abstract

Autophagy is a highly regulated and evolutionarily conserved process of cellular self-digestion. Recent evidence suggests that this process plays an important role in regulating T cell homeostasis. In this study, we used Rag1(-/-) (recombination activating gene 1(-/-)) blastocyst complementation and in vitro embryonic stem cell differentiation to address the role of Beclin 1, one of the key autophagic proteins, in lymphocyte development. Beclin 1-deficient Rag1(-/-) chimeras displayed a dramatic reduction in thymic cellularity compared with control mice. Using embryonic stem cell differentiation in vitro, we found that the inability to maintain normal thymic cellularity is likely caused by impaired maintenance of thymocyte progenitors. Interestingly, despite drastically reduced thymocyte numbers, the peripheral T cell compartment of Beclin 1-deficient Rag1(-/-) chimeras is largely normal. Peripheral T cells displayed normal in vitro proliferation despite significantly reduced numbers of autophagosomes. In addition, these chimeras had greatly reduced numbers of early B cells in the bone marrow compared with controls. However, the peripheral B cell compartment was not dramatically impacted by Beclin 1 deficiency. Collectively, our results suggest that Beclin 1 is required for maintenance of undifferentiated/early lymphocyte progenitor populations. In contrast, Beclin 1 is largely dispensable for the initial generation and function of the peripheral T and B cell compartments. This indicates that normal lymphocyte development involves Beclin 1-dependent, early-stage and distinct, Beclin 1-independent, late-stage processes.


Figures

Figure 1
Figure 1
T cell development in the absence of Beclin 1. Single cell suspensions were generated from thymi and spleens of Beclin 1−/− →Rag 1−/− and control chimeras, stained with antibodies against CD4 and CD8 and analyzed by flow cytometry. The percentage of cells within each T cell subset defined by the corresponding quadrants of the dot plots is indicated. Data from three different experiments (A, B, and C) are shown. (D) Absolute numbers of thymocytes and spleen cells in Beclin 1−/− →Rag 1−/− and control chimeras as determined by trypan blue exclusion test. Each symbol represents an individual mouse. (E) The analysis of DN thymocytes in Beclin 1-deficient chimeras. The expression of CD25 and CD44 on pre-gated Ly9.1+CD4CD8CD3 thymocytes is shown. The analysis was repeated three times with similar results. All chimeras were 5–8 weeks of age.
Figure 2
Figure 2
Beclin 1-deficient ESCs fail to maintain normal T cell development in vitro. T cells differentiation from Beclin 1−/− and control ESCs was carried out in the presence of OP9-DL1 cells, as described in Materials and Methods. The co-culture aliquots were taken at days 12 (A) and 19/20 (C), stained with indicated antibodies, and analyzed using flow cytometry. The experiments were repeated three times with similar results. (B) The ratio of CD25:CD45 positive cells in Beclin 1−/− and control co-cultures at day 12 indicating equivalent rates of DN2/3 cell generation from CD45+ precursors in both co-cultures. (D) Distribution of T cell subsets based on the expression of CD4 and CD8 surface markers in Beclin 1−/− and control co-cultures at day 19/20. Data represent average percentages ± SD of cells from three independent experiments.
Figure 3
Figure 3
Characterization of Beclin 1-deficient peripheral T cells. (A) Absolute numbers of spleen CD4+ and CD8+ T cells from Beclin 1−/− →Rag 1−/− chimeric mice (open bars) and control mice (filled bars). Bars represent means of at least four experiments ± SD. (B) FACS analysis of CD44 and CD62L marker expressions on CD4+ (upper panels) and CD8+ (lower panels) T cells from Beclin 1−/− →Rag 1−/− chimeric mice and control mice. Data are representative of four independent experiments. The percentage of cells in each quadrant is indicated. Proliferative response of Beclin 1-deficient and control spleen T cells to in vitro stimulation with plate-bound 2C11 antibody as measured by colorimetric BrdU-incorporation assay (C) and CFSE (D). Data points in Figure 3C represent means of triplicate cultures ± SD. Data are representative of two independent experiments. CFSE-labeled proliferating CD4+ (upper panels) and CD8+ T cells (lower panels) in Figure 3D are indicated with elliptical gates. (E) Induction of activation markers CD69 and CD25 on Beclin 1-deficient and control CD4+ and CD8+ T cells following activation with plate-bound 2C11 antibody.
Figure 4
Figure 4
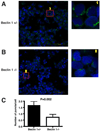
Reduced number of LC3 puncta in activated, Beclin 1-deficient T cells. Confocal microscopy images of immunofluorescent staining with anti-LC3 antibody reveals a punctate localization of LC3 in activated T cells from Beclin 1+/− (A), as well as Beclin 1−/− →Rag 1−/− chimeras (B). Two smaller images in the bottom represent enlarged areas defined by two red rectangles. The average numbers of LC3 puncta in activated T cells from Beclin 1+/− vs. Beclin 1−/− →Rag 1−/− chimeras counted by confocal microscopy from 12 fields, each 52,430 µm2 in area ± SD (C). Original magnification × 400.
Figure 5
Figure 5
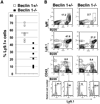
Compromised reconstitution of B cell development in the bone marrow of Rag 1−/− mice by Beclin 1-deficient ESCs. (A) Frequency of Ly9.1+ cells in the bone marrow of age and sex-matched Beclin 1−/− →Rag 1−/− and control chimeras as determined by flow cytometry. All mice were used between 4 and 8 weeks of age. (B) Bone marrow cells were stained with fluorescently-labeled antibodies against indicated B cell markers as well as Ly9.1 and analyzed by flow cytometry. The bottom histogram represents the expression of Ly9.1 on pro and pre-B cells as defined by CD43 and B220 surface markers. Gate positions are indicated with rectangles. The analysis was repeated three times with similar results.
Figure 6
Figure 6
Reduced early bone marrow emigrant B2 cell numbers but otherwise preserved peripheral B2 and B1 B cell subsets in the absence of Beclin 1. (A) Spleen cells from chimeric mice were stained with indicated fluorescently-labeled antibodies and analyzed by flow cytometry. The applied gates are indicated above each pair of contour blots. Note the reduction in CD21 CD23IgM+ cell subset representing the subset of recent bone marrow emigrants (bottom pair of plots). (B) Peritoneal exudate cells from chimeric mice were stained with antibodies against CD5, IgM, and CD23. The expression of CD5 and IgM on CD23 cells is shown. (C) Purified splenic B cells (2×10⁵/well) from chimeric mice were incubated in 96-well plates in the presence of LPS (25 µg/ml) and IL-4 (5 ng/ml), and proliferation assay carried our as described in Materials and Methods. Bars represent means of triplicate cultures ± SD. Data are representative from three independent experiments.
Figure 7
Figure 7
Reduced CLP and HSC compartments in the bone barrow of Beclin 1−/− →Rag 1−/− chimeric mice. Frequencies of Beclin 1-deficient ESC-derived (A) CLPs and (B) HSCs were determined based on the expression of Ly9.1 (32). CLPs are defined as LinCD127+C-Kitlo Sca-1lo and HSC as LinCD127c-Kit+ Sca-1+ cells (22, 33). Bone marrow cells were stained with indicated antibodies and analyzed using LSR II flow cytometer. Gate positions were indicated with rectangles. The percentage of positive cells within each subset defined by corresponding gates within contour plots and histograms are indicated with small numbers within each gate. Data are representative from three independent experiments.

References

    1. Levine B, Kroemer G. Autophagy in the pathogenesis of disease. Cell. 2008;132:27–42. - PMC - PubMed
    1. Matsunaga K, Noda T, Yoshimori T. Binding Rubicon to cross the Rubicon. Autophagy. 2009;5:876–877. - PubMed
    1. Liang XH, Kleeman LK, Jiang HH, Gordon G, Goldman JE, Berry G, Herman B, Levine B. Protection against fatal Sindbis virus encephalitis by beclin, a novel Bcl-2-interacting protein. J Virol. 1998;72:8586–8596. - PMC - PubMed
    1. Pattingre S, Tassa A, Qu X, Garuti R, Liang XH, Mizushima N, Packer M, Schneider MD, Levine B. Bcl-2 antiapoptotic proteins inhibit Beclin 1-dependent autophagy. Cell. 2005;122:927–939. - PubMed
    1. Furuya D, Tsuji N, Yagihashi A, Watanabe N. Beclin 1 augmented cis-diamminedichloroplatinum induced apoptosis via enhancing caspase-9 activity. Exp Cell Res. 2005;307:26–40. - PubMed

Publication types

MeSH terms