. 2011 Feb;17(2):223-8.
doi: 10.1038/nm.2292. Epub 2011 Jan 16.

Time-lapse imaging of disease progression in deep brain areas using fluorescence microendoscopy

Affiliations

Time-lapse imaging of disease progression in deep brain areas using fluorescence microendoscopy

Robert P J Barretto et al. Nat Med. 2011 Feb.

Abstract

The combination of intravital microscopy and animal models of disease has propelled studies of disease mechanisms and treatments. However, many disorders afflict tissues inaccessible to light microscopy in live subjects. Here we introduce cellular-level time-lapse imaging deep within the live mammalian brain by one- and two-photon fluorescence microendoscopy over multiple weeks. Bilateral imaging sites allowed longitudinal comparisons within individual subjects, including of normal and diseased tissues. Using this approach, we tracked CA1 hippocampal pyramidal neuron dendrites in adult mice, revealing these dendrites' extreme stability and rare examples of their structural alterations. To illustrate disease studies, we tracked deep lying gliomas by observing tumor growth, visualizing three-dimensional vasculature structure and determining microcirculatory speeds. Average erythrocyte speeds in gliomas declined markedly as the disease advanced, notwithstanding significant increases in capillary diameters. Time-lapse microendoscopy will be applicable to studies of numerous disorders, including neurovascular, neurological, cancerous and trauma-induced conditions.


Figures

Figure 1
Figure 1. Chronic mouse preparation for repeated imaging of deep brain tissues using microendoscopy
a. The experiment begins with implantation of imaging guide tubes, one into each hemisphere of the mouse's brain. After the animal recovers from surgery, micro-optical probes can be repeatedly inserted into the guide tubes to allow time-lapse imaging. b. Three microendoscope probes, a 500-μm-diameter singlet, a 1-mm-diameter singlet, and a 1-mm-diameter compound doublet. Scale bar is 1 mm. c. Schematic of a microscope objective lens coupling illumination into a 500-μm-diameter singlet microendoscope probe, such as shown in (b).
Figure 2
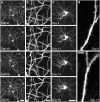
Figure 2. Time-lapse two-photon microendoscopy of CA1 hippocampal neurons
Time-lapse image sequences of CA1 pyramidal neurons in three Thy1-GFP mice. a, b. 2D projections of 3D stacks containing four image slices acquired at 4.2 μm axial spacing over 16.8 μm in depth. (b) shows enlargements of the boxed area in (a). c. 2D projections of 3D stacks acquired at 3 μm axial spacing over approximately 540 μm in depth. d. Enlarged, single image frames revealing spiny dendrites. Scale bars in (a), (b), (c), and (d) are 100, 25, 50, and 5 μm, respectively.
Figure 3
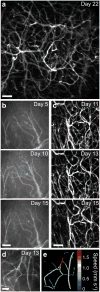
Figure 3. Time-lapse microendoscopy of CA1 microvasculature shows normal blood vessel morphologies are stable over time
a. 2D projection of a 3D stack of 220 images of dye-labeled vasculature acquired at ∼3 μm increments over ∼660 μm in depth. Supplementary Video 1 shows the entire image stack. b. Time-lapse image sequence acquired by one-photon microendoscopy. c. Time-lapse sequence of image stacks, each composed of 40-50 images acquired approximately 3.7 μm apart in depth and projected to 2D. Fig. 4b shows dye-labeled tumor vessels from the opposing (experimental) hippocampus in the same mouse. d, e. One-photon image of CA1 blood vessels, (d), and corresponding microcirculatory speed map, (e), determined by high-speed (100 Hz) imaging and cross-correlation analysis. Supplementary Video 2 shows blood flow from this same field of view. Scale bars are 100 μm in (a–c), 50 μm in (d).
Figure 4
Figure 4. Time-lapse imaging of glioma angiogenesis in mouse CA1 reveals progressive distortions to vascular geometry and reduced microcirculation
a. Dual-color image of GFP-expressing murine glioma cells (green) and rhodamine-dextran labeled microvasculature (red), acquired in a live mouse by one-photon fluorescence microendoscopy on day 3 after glioma cell inoculation. b, c. Time-lapse sequences of two-photon microendoscopy image stacks, projected to 2D, showing the progressive distortion of the microvasculature due to glioma angiogenesis. Each stack contained 40–50 images acquired 3.7 μm apart in depth. Fig. 3c shows images of the opposing (control) hippocampus from the same mouse used in (b). d. Maps of average erythrocyte speed, determined from 10 s videos acquired at 100 Hz by one-photon microendoscopy, in left (control) and right (experimental) hemispheres of a live mouse on day 20 following glioma inoculation. Scale bars are 100 μm.
Figure 5
Figure 5. Quantitative tracking of glioma angiogenesis in CA1 hippocampus shows tumor vessels broaden in diameter but undergo marked declines in flow speed
Vessel diameters and erythrocyte flow speeds were monitored as a function of elapsed time following an initial surgery and glioma cell implantation on day 0. Not all animals were imaged at identical time points, so time values were binned into 3-day intervals. a. Plots of flow speed versus vessel diameter, for control tissue (left panel) and tumor sites (right panel), in which each data point represents an individual vessel segment. Unlike at control sites, at tumor sites the data reveal an overall progressive decrease in flow speeds and increase in vessel diameters as the disease advanced (n = 10 mice). b. Population averages of vessel diameter (right panel) and erythrocyte flow speed (left panel) are plotted (mean ± s.e.m.) versus elapsed time. Closed red circles represent data from glioma sites, open blue triangles from normal tissue. Mean tumor vessel diameters and flow speeds differed significantly from control values (P < 10-6 and P < 10-15, respectively; Mann-Whitney U-test).

References

    1. Bullen A. Microscopic imaging techniques for drug discovery. Nat Rev Drug Discov. 2008;7:54–67. - PubMed
    1. Melder RJ, Salehi HA, Jain RK. Interaction of activated natural killer cells with normal and tumor vessels in cranial windows in mice. Microvasc Res. 1995;50:35–44. - PubMed
    1. Lichtman JW, Magrassi L, Purves D. Visualization of neuromuscular junctions over periods of several months in living mice. J Neurosci. 1987;7:1215–1222. - PMC - PubMed
    1. Grutzendler J, Kasthuri N, Gan WB. Long-term dendritic spine stability in the adult cortex. Nature. 2002;420:812–816. - PubMed
    1. Trachtenberg JT, et al. Long-term in vivo imaging of experience-dependent synaptic plasticity in adult cortex. Nature. 2002;420:788–794. - PubMed

Publication types