Comparative Study
. 2011 Jan 17;11(1):6.
doi: 10.1186/1471-2288-11-6.

Bikeability and methodological issues using the active commuting route environment scale (ACRES) in a metropolitan setting

Affiliations
Comparative Study

Bikeability and methodological issues using the active commuting route environment scale (ACRES) in a metropolitan setting

Lina Wahlgren et al. BMC Med Res Methodol. .

Abstract

Background: Route environments can positively influence people's active commuting and thereby contribute to public health. The Active Commuting Route Environment Scale (ACRES) was developed to study active commuters' perceptions of their route environments. However, bicycle commuters represent a small portion of the population in many cities and thus are difficult to study using population-based material. Therefore, the aim of this study is to expand the state of knowledge concerning the criterion-related validity of the ACRES and the representativity using an advertisement-recruited sample. Furthermore, by comparing commuting route environment profiles of inner urban and suburban areas, we provide a novel basis for understanding the relationship between environment and bikeability.

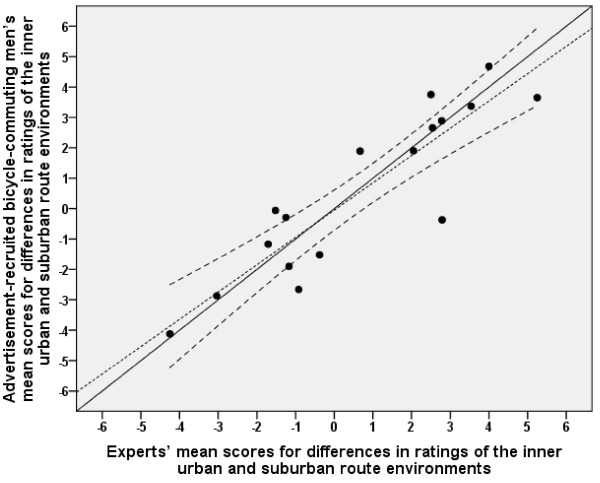
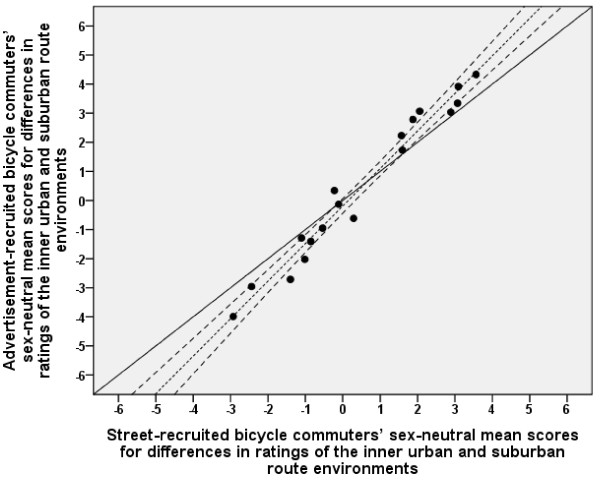
Methods: Bicycle commuters from Greater Stockholm, Sweden, advertisement- (n = 1379) and street-recruited (n = 93), responded to the ACRES. Traffic planning and environmental experts from the Municipality of Stockholm (n = 24) responded to a modified version of the ACRES. The criterion-related validity assessments were based on whether or not differences between the inner urban and the suburban route environments, as indicated by the experts and by four existing objective measurements, were reflected by differences in perceptions of these environments. Comparisons of ratings between advertisement- and street-recruited participants were used for the assessments of representativity. Finally, ratings of inner urban and suburban route environments were used to evaluate commuting route environment profiles.

Results: Differences in ratings of the inner urban and suburban route environments by the advertisement-recruited participants were in accord with the existing objective measurements and corresponded reasonably well with those of the experts. Overall, there was a reasonably good correspondence between the advertisement- and street-recruited participants' ratings. Distinct differences in commuting route environment profiles were noted between the inner urban and suburban areas. Suburban route environments were rated as safer and more stimulating for bicycle-commuting than the inner urban ones. In general, the findings applied to both men and women.

Conclusions: The overall results show: considerable criterion-related validity of the ACRES; ratings of advertisement-recruited participants mirroring those of street-recruited participants; and a higher degree of bikeability in the suburban commuting route environments than in the inner urban ones.


Figures

Figure 1
Figure 1
Aerial view from 2005 over the more central parts of Greater Stockholm, Sweden. The yellow line distinguishes the inner urban and the suburban as well as rural parts of the study area. For description of the characteristics of the study area, see Methods. (Copyright: Lantmäteriverket, Gävle, Sweden.)
Figure 2
Figure 2
Relationship between advertisement-recruited women and experts in differences between inner urban and suburban route environments. The solid diagonal line represents the line of identity (slope = 1.0 and y-intercept = 0.0). The dotted line represents the linear regression line. The upper and lower dashed lines on either side of the linear regression line represent the 95% confidence interval (CI). The regression line (y = -0.03 [-0.80 - 0.75] + 0.84 [0.55 - 1.12] ×, [95% CI]) did not deviate significantly from the line of identity. Note that the means are sometimes minus values. The interpretation of the y-intercept could therefore be misleading. The 95% CI for the slope therefore gives a better picture, showing that the linear regression line did not deviate significantly from the line of identity. Pearson's correlation was 0.85.
Figure 3
Figure 3
Relationship between advertisement-recruited men and experts in differences between inner urban and suburban route environments. The solid diagonal line represents the line of identity (slope = 1.0 and y-intercept = 0.0). The dotted line represents the linear regression line. The upper and lower dashed lines on either side of the linear regression line represent the 95% confidence interval (CI). The regression line (y = -0.05 [-0.71 - 0.61] + 0.90 [0.66 - 1.14] ×, [95% CI]) did not deviate significantly from the line of identity. Note that the means are sometimes minus values. The interpretation of the y-intercept could therefore be misleading. The 95% CI for the slope therefore gives a better picture, showing that the linear regression line did not deviate significantly from the line of identity. Pearson's correlation was 0.90.
Figure 4
Figure 4
Relationship between advertisement-recruited and street-recruited participants' ratings of inner urban route environments. The mean values are expressed as sex-neutral means. The solid diagonal line represents the line of identity (slope = 1.0 and y-intercept = 0.0). The dotted line represents the linear regression line. The regression line (y = 0.59 [-0.30 - 1.49] + 0.90 [0.80 - 1.01] ×, [95% confidence interval]) did not deviate significantly from the line of identity. Pearson's correlation was 0.98.
Figure 5
Figure 5
Relationship between advertisement-recruited and street-recruited participants' ratings of suburban route environments. The mean values are expressed as sex-neutral means. The solid diagonal line represents the line of identity (slope = 1.0 and y-intercept = 0.0). The dotted line represents the linear regression line. The regression line (y = -0.63 [-2.08 - 0.81] + 1.05 [0.88 - 1.22] ×, [95% confidence interval]) did not deviate significantly from the line of identity. Pearson's correlation was 0.96.
Figure 6
Figure 6
Relationship between advertisement-recruited and street-recruited participants in differences between inner urban and suburban route environments. The mean values are expressed as sex-neutral means. The solid diagonal line represents the line of identity (slope = 1.0 and y-intercept = 0.0). The dotted line represents the linear regression line. The upper and lower dashed lines on either side of the linear regression line represent the 95% confidence interval (CI). The regression line (y = -0.19 [-0.44 - 0.06] + 1.29 [1.17 - 1.42] ×, [95% CI]) deviated slightly from the line of identity. Note that the means are sometimes minus values. The interpretation of the y-intercept could therefore be misleading. The 95% CI for the slope therefore gives a better picture, showing that the linear regression line deviated slightly from the line of identity. Pearson's correlation was 0.98.
Figure 7
Figure 7
Commuting route environment profiles for women cycling in the inner urban and suburban areas. Advertisement-recruited participants: Both I&S = those who bicycle-commuted in both the inner urban and suburban areas, Only I = those who bicycle-commuted in only the inner urban area and Only S = those who bicycle-commuted in only the suburban area. Unfilled symbols represent ratings of the inner urban route environments. Filled symbols represent the suburban route environments. *Minimal value = 0 and maximal value = 10.
Figure 8
Figure 8
Commuting route environment profiles for men cycling in the inner urban and suburban areas. Advertisement-recruited participants: Both I&S = those who bicycle-commuted in both the inner urban and suburban areas, Only I = those who bicycle-commuted in only the inner urban area and Only S = those who bicycle-commuted in only the suburban area. Unfilled symbols represent ratings of the inner urban route environments. Filled symbols represent the suburban route environments. *Minimal value = 0 and maximal value = 10.

Similar articles

Cited by

References

    1. World Health Organization (WHO) Global Strategy on Diet, Physical Activity, and Health. Geneva: WHO; 2004.
    1. Shephard RJ. Is active commuting the answer to population health? Sports Med. 2008;38(9):751–758. doi: 10.2165/00007256-200838090-00004. - DOI - PubMed
    1. Sallis JF, Cervero RB, Ascher W, Henderson KA, Kraft MK, Kerr J. An ecological approach to creating active living communities. Annu Rev Public Health. 2006;27:297–322. doi: 10.1146/annurev.publhealth.27.021405.102100. - DOI - PubMed
    1. Gebel K, Bauman AE, Petticrew M. The physical environment and physical activity: a critical appraisal of review articles. Am J Prev Med. 2007;32(5):361–369. doi: 10.1016/j.amepre.2007.01.020. - DOI - PubMed
    1. Brownson RC, Hoehner CM, Day K, Forsyth A, Sallis JF. Measuring the built environment for physical activity: state of the science. Am J Prev Med. 2009;36(Suppl 4):99–123. doi: 10.1016/j.amepre.2009.01.005. - DOI - PMC - PubMed

Publication types

MeSH terms

LinkOut - more resources