

Strong functional patterns in the evolution of eukaryotic genomes revealed by the reconstruction of ancestral protein domain repertoires
- PMID: 21241503
- PMCID: PMC3091302
- DOI: 10.1186/gb-2011-12-1-r4
Strong functional patterns in the evolution of eukaryotic genomes revealed by the reconstruction of ancestral protein domain repertoires
Abstract
Background: Genome size and complexity, as measured by the number of genes or protein domains, is remarkably similar in most extant eukaryotes and generally exhibits no correlation with their morphological complexity. Underlying trends in the evolution of the functional content and capabilities of different eukaryotic genomes might be hidden by simultaneous gains and losses of genes.
Results: We reconstructed the domain repertoires of putative ancestral species at major divergence points, including the last eukaryotic common ancestor (LECA). We show that, surprisingly, during eukaryotic evolution domain losses in general outnumber domain gains. Only at the base of the animal and the vertebrate sub-trees do domain gains outnumber domain losses. The observed gain/loss balance has a distinct functional bias, most strikingly seen during animal evolution, where most of the gains represent domains involved in regulation and most of the losses represent domains with metabolic functions. This trend is so consistent that clustering of genomes according to their functional profiles results in an organization similar to the tree of life. Furthermore, our results indicate that metabolic functions lost during animal evolution are likely being replaced by the metabolic capabilities of symbiotic organisms such as gut microbes.
Conclusions: While protein domain gains and losses are common throughout eukaryote evolution, losses oftentimes outweigh gains and lead to significant differences in functional profiles. Results presented here provide additional arguments for a complex last eukaryotic common ancestor, but also show a general trend of losses in metabolic capabilities and gain in regulatory complexity during the rise of animals.
Figures


References
-
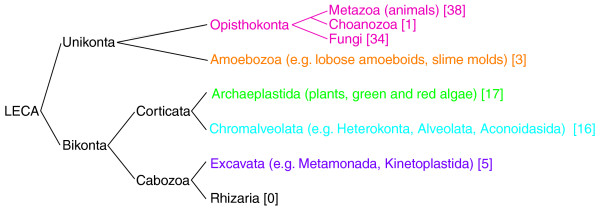
- Baldauf S. An overview of the phylogeny and diversity of eukaryotes. J Systemat Evol. 2008;46:263–273. http://www.plantsystematics.com/qikan/manage/wenzhang/jse08060.pdf
-
- Valentine J, Collins A, Meyer P. Morphological complexity increase in metazoans. Paleobiology. 1994;20:131–142. http://www.jstor.org/pss/2401015
