. 2011 Apr 7;274(1):109-19.
doi: 10.1016/j.jtbi.2011.01.011. Epub 2011 Jan 15.

Response of an actin filament network model under cyclic stretching through a coarse grained Monte Carlo approach

Affiliations

Response of an actin filament network model under cyclic stretching through a coarse grained Monte Carlo approach

John Kang et al. J Theor Biol. .

Abstract

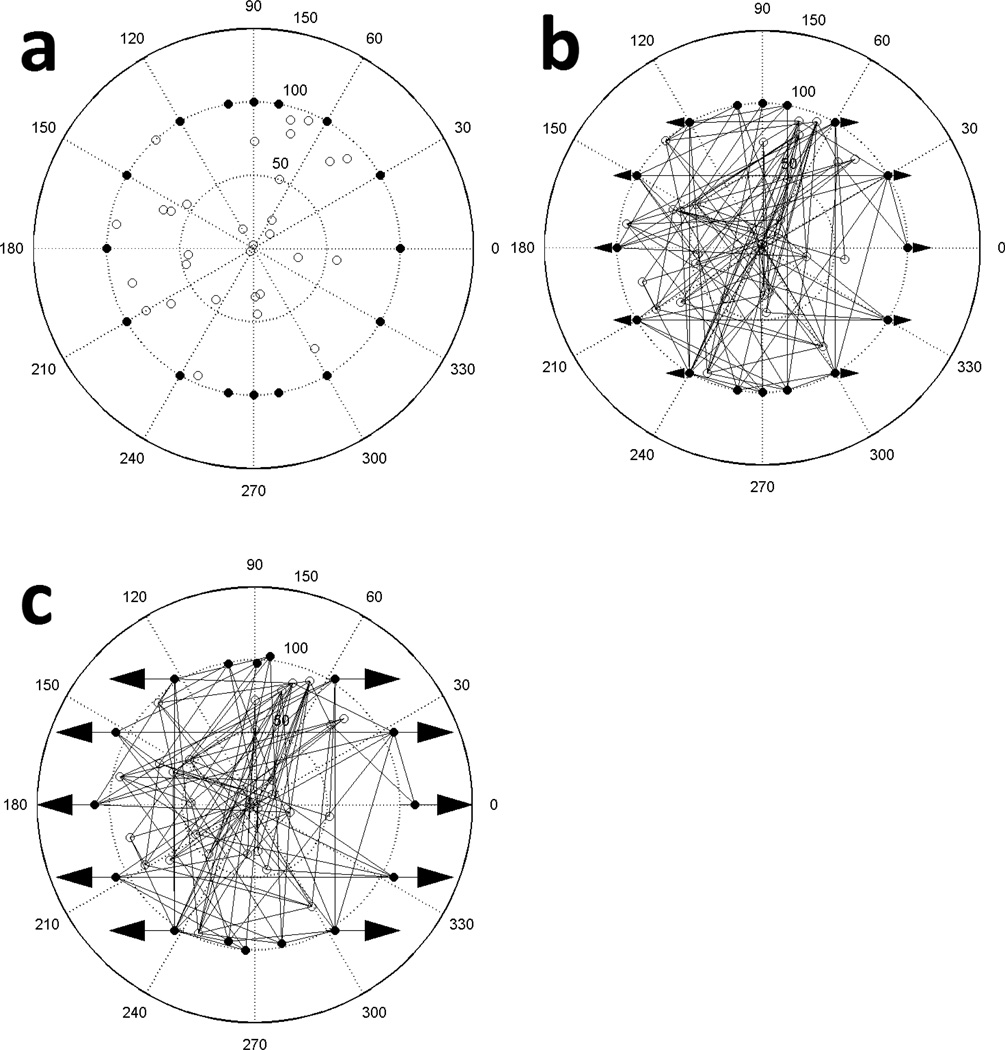
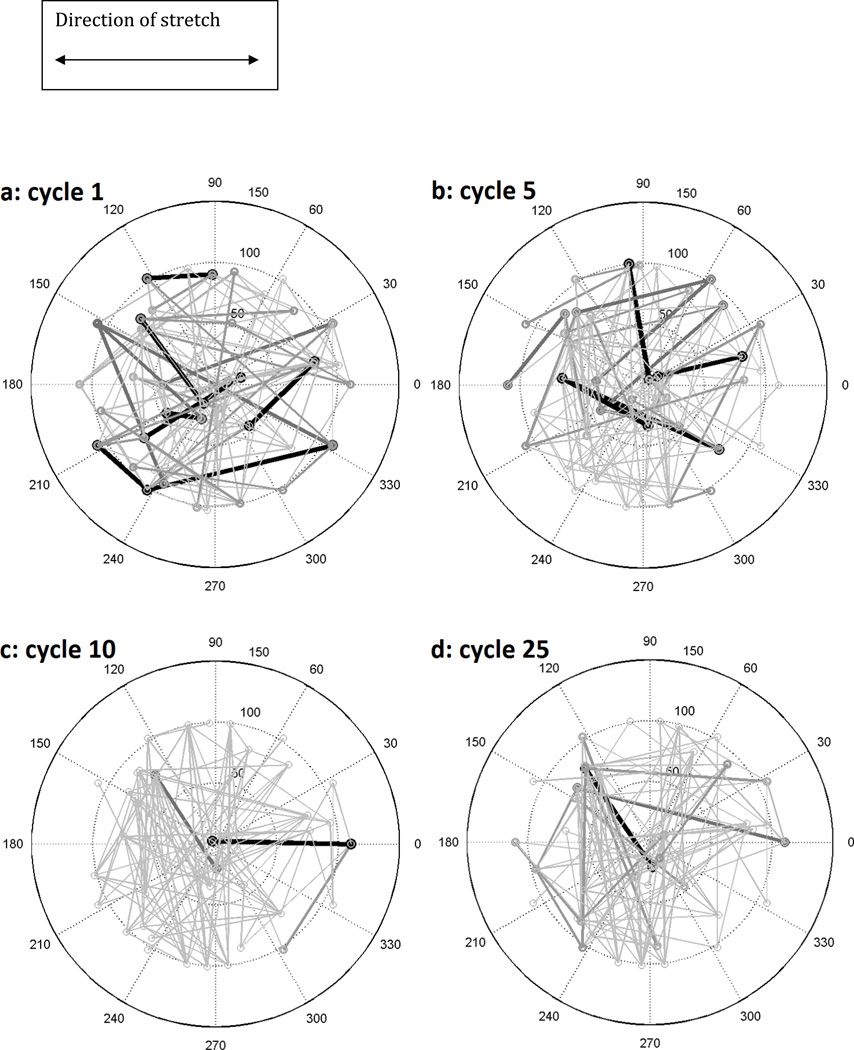
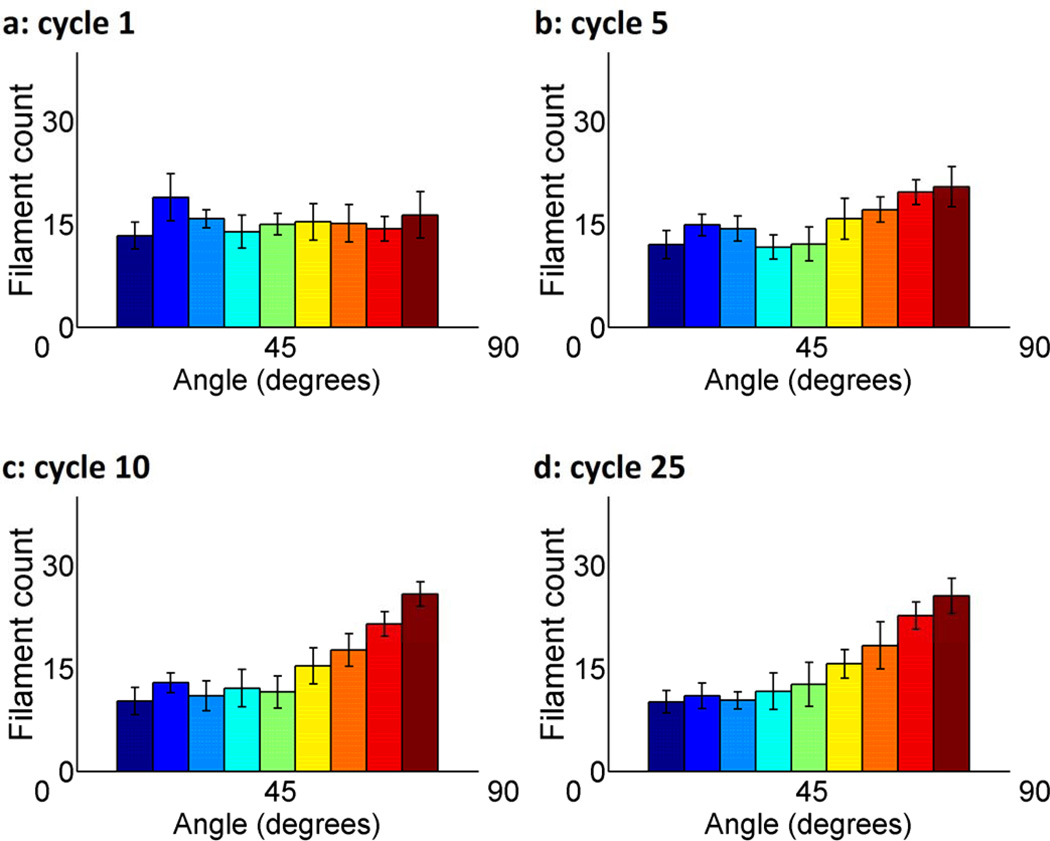
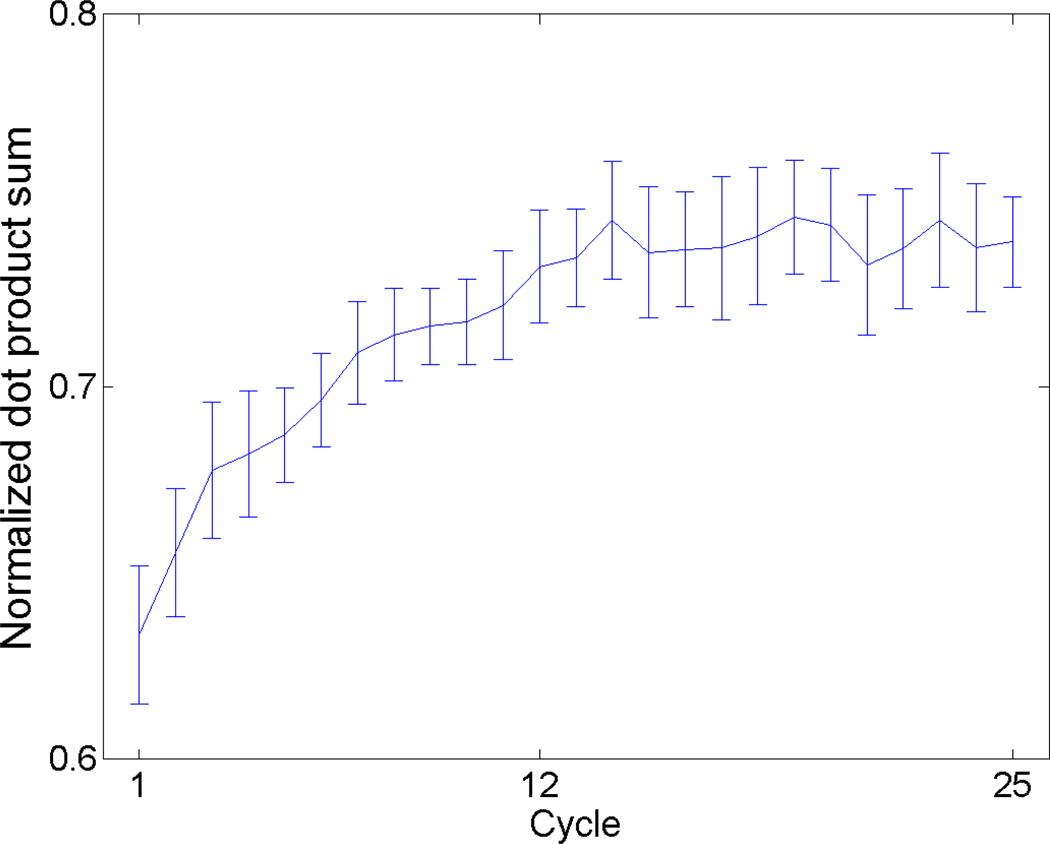
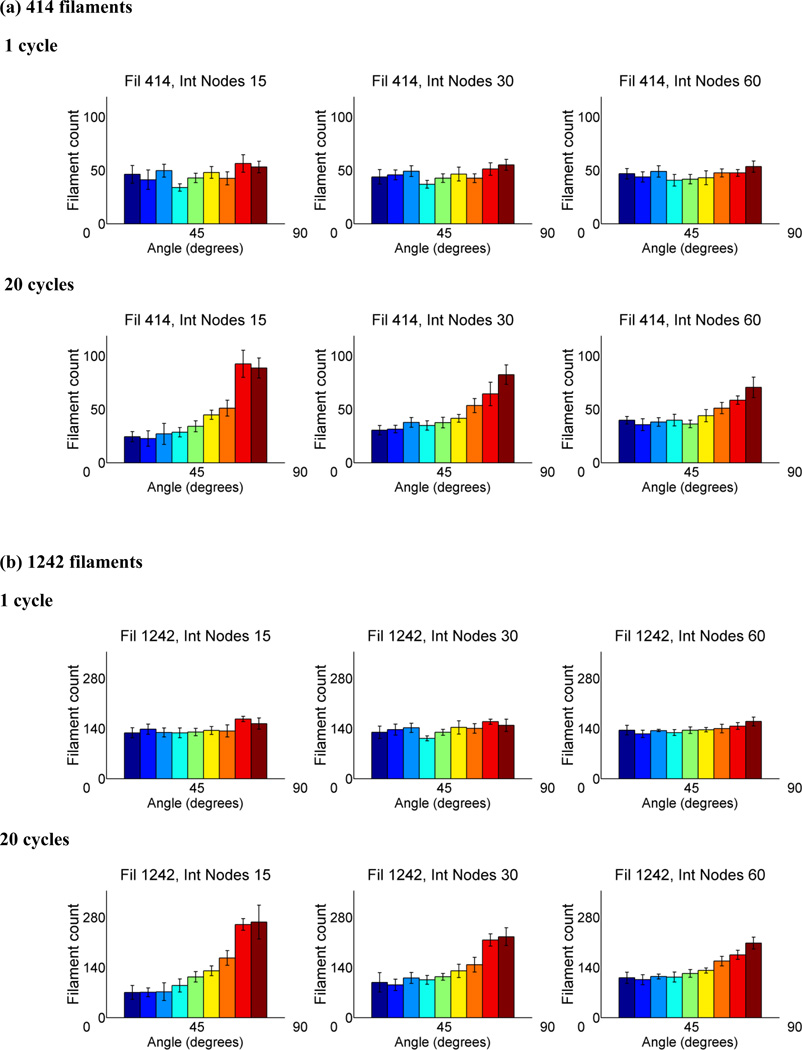
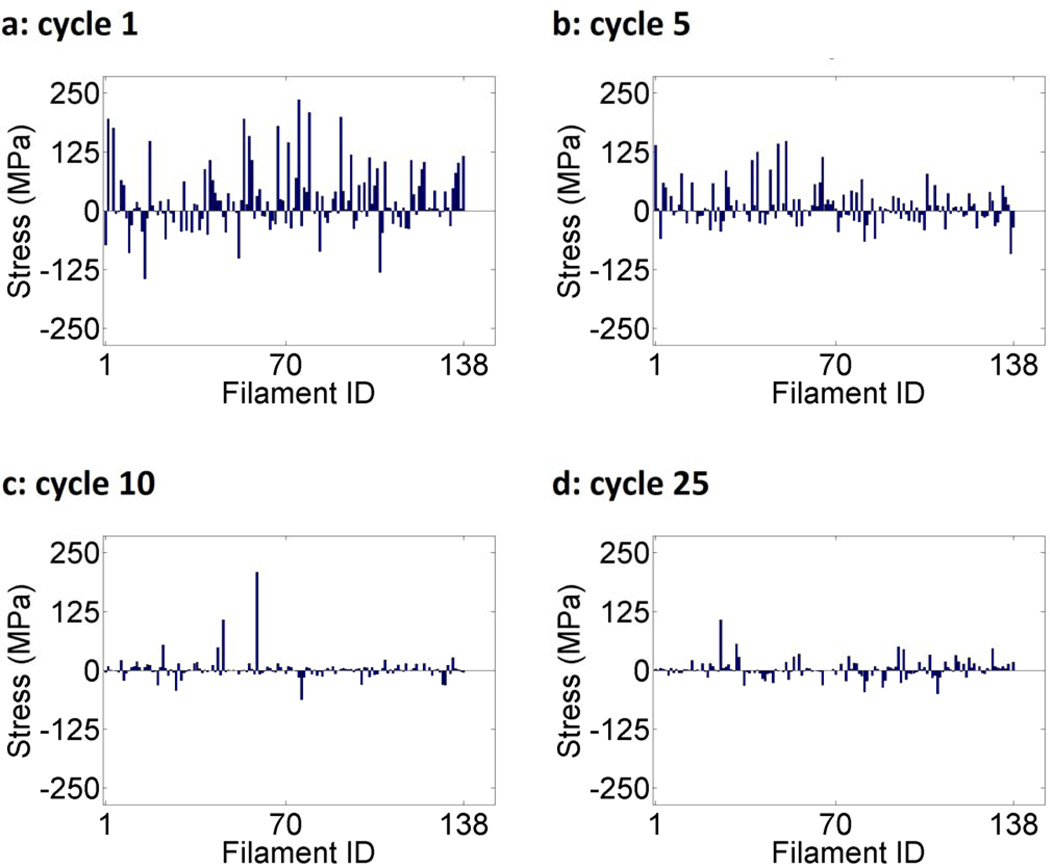
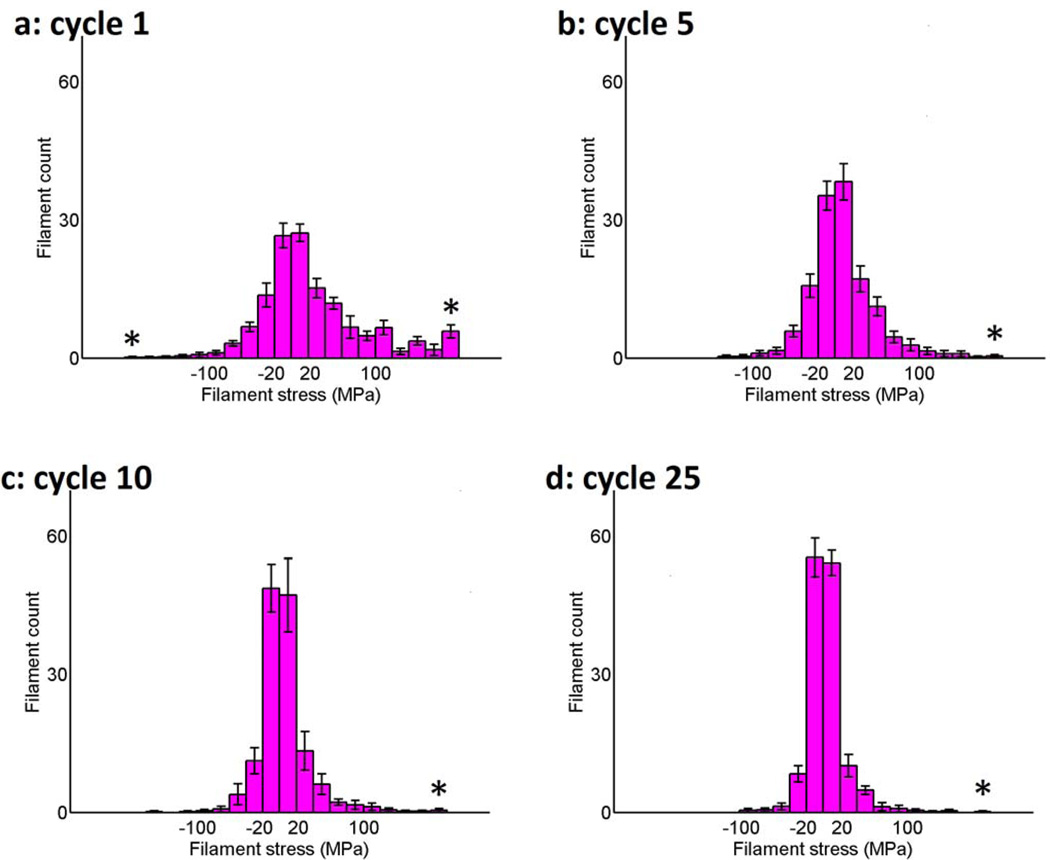
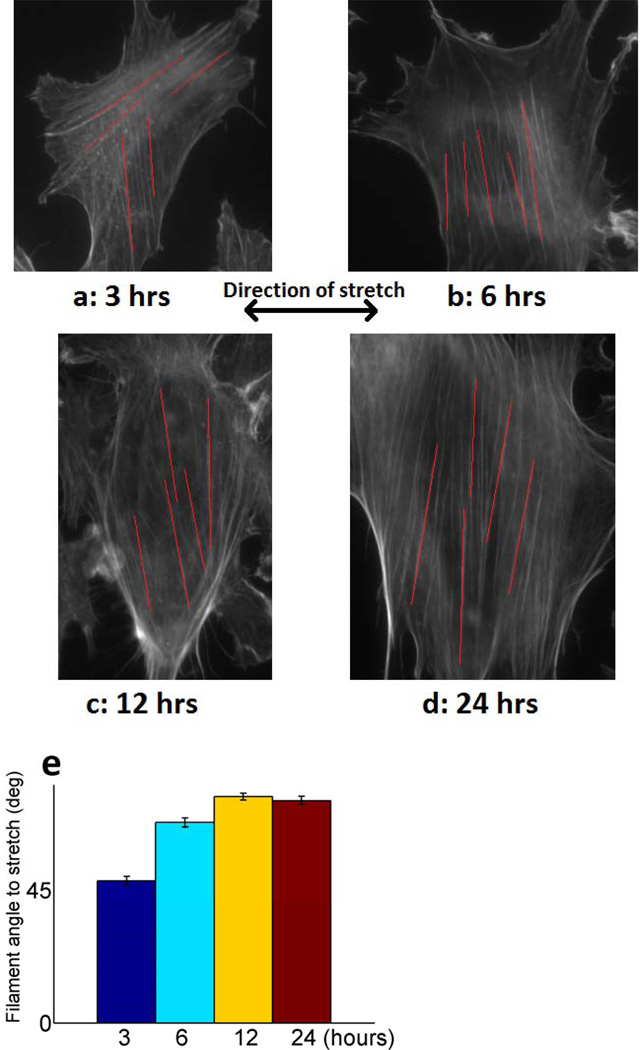
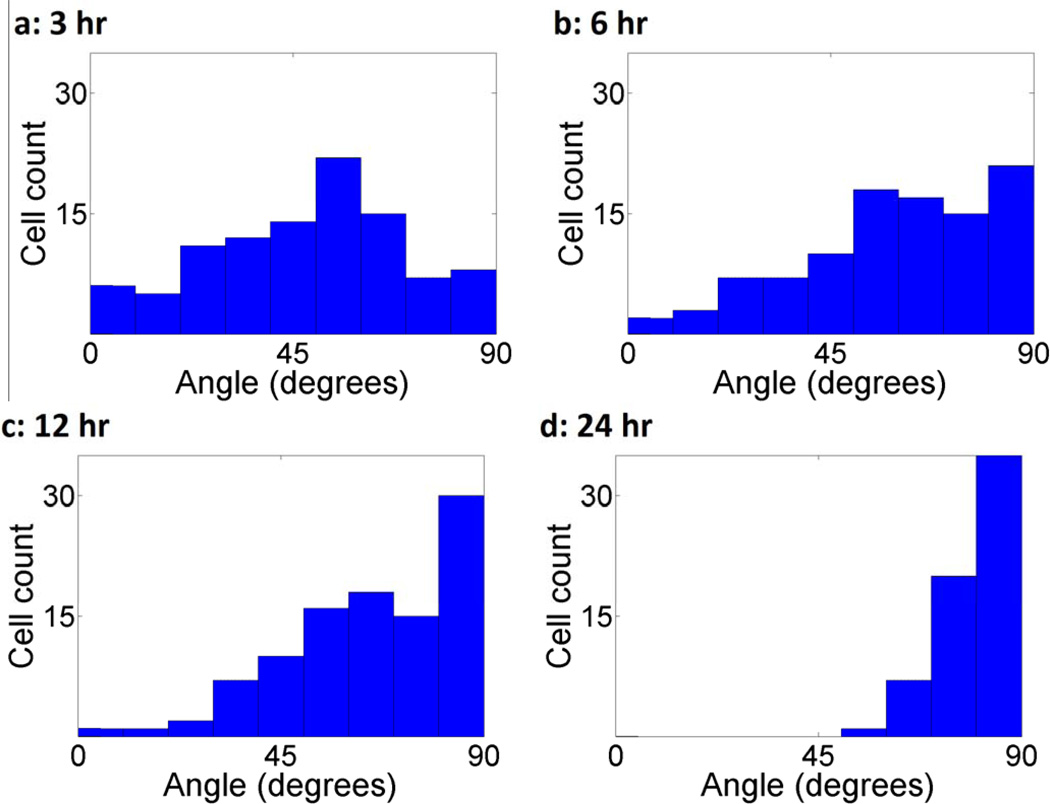
Cells are complex, dynamic systems that actively adapt to various stimuli including mechanical alterations. Central to understanding cellular response to mechanical stimulation is the organization of the cytoskeleton and its actin filament network. In this manuscript, we present a minimalistic network Monte Carlo based approach to model actin filament organization under cyclic stretching. Utilizing a coarse-grained model, a filament network is prescribed within a two-dimensional circular space through nodal connections. When cyclically stretched, the model demonstrates that a perpendicular alignment of the filaments to the direction of stretch emerges in response to nodal repositioning to minimize net nodal forces from filament stress states. In addition, the filaments in the network rearrange and redistribute themselves to reduce the overall stress by decreasing their individual stresses. In parallel, we cyclically stretch NIH 3T3 fibroblasts and find a similar cytoskeletal response. With this work, we test the hypothesis that a first-principles mechanical model of filament assembly in a confined space is by itself capable of yielding the remodeling behavior observed experimentally. Identifying minimal mechanisms sufficient to reproduce mechanical influences on cellular structure has important implications in a diversity of fields, including biology, physics, medicine, computer science, and engineering.


Figures

Figure 1
Figure 1
Our computational model for representing a simplified actin filament network of an approximately circular cell under mechanical stimulation. (a) The node distribution of the network of 100 arbitrary unit radius with filaments removed. 16 nodes are assigned to specific locations on the perimeter (filled circles) and can act as fixed connections (mimicking focal adhesions). 30 interior nodes (open circles) are placed randomly and function as links between filaments (mimicking linking proteins such as filamin). (b) 138 filament network with both nodes and filaments represented. Linear fibers are formed by randomly selecting two nodes for each fiber; the nodes locate the ends of a fiber and define its length and orientation. Arrows denote which perimeter nodes will be stretched and the direction of stretch. (c) Configuration after stretching the arrowed perimeter nodes by 10% of their X-axis position in the direction of the arrows and after node network equilibrium has been achieved. The model was considered in equilibrium when the summation of the absolute magnitude of all the nodal forces was less than a prescribed tolerance.
Figure 2
Figure 2
A filament network of 138 filaments, 16 prescribed perimeter nodes, and 30 randomly placed internal nodes under 10% uniaxial horizontal stretch after (a) 1, (b) 5, (c) 10, and (d) 25 iterative cycles. Stretch was imposed in 1% increments on all peripheral nodes from −60° to 60° and 120° to 240°followed by Gauss-Seidel relaxation to achieve network nodal force equilibrium. The depicted thickness/darkness of the filaments correspond to their relative stresses with the thickest/darkest being >75% of the maximum stress of the network and the thinnest/lightest being <25%. The length scale in this model is 100 arbitrary units, representing a cell whose bulk lies in an approximately circular region of diameter 30 µm, such as a fibroblast.
Figure 3
Figure 3
Histograms of angular orientation of filaments in nodal equilibrium after (a) 1, (b) 5, (c) 10, and (d) 25 iterative cycles of 10% uniaxial horizontal stretch. Averaged over ten uniquely generated filament networks, each of which consisted of 138 filaments distributed among 16 prescribed perimeter nodes and 30 randomly placed interior nodes. Each filament connects two nodes. Error bars denote 95% confidence interval.
Figure 4
Figure 4
Normalized dot product between filament angles and the filament network mean angle at nodal equilibrium over cycles 1–25. For each cycle, filament lengths were all assumed to equal 1 and the average dot product between each filament angle and the mean filament network angle were averaged over 10 uniquely generated networks. All filament lengths were normalized to 1 to maintain equal representation among all filaments. If all of the 138 filaments aligned exactly with the filament network mean angle, the normalized dot product sum would be 1.0 for that cycle. Error bars denote 95% confidence interval.
Figure 5
Figure 5
Histograms of angular orientation of filaments in nodal equilibrium after 1 cycle and 20 cycles for networks with (A) 414 and (B) 1242 filaments, which are 3 fold and 9 fold multiples of the previous filament number, 138. The number of internal nodes was varied as well from 15, 30, to 60 while peripheral nodes were held constant at 16. The results were averaged over eight uniquely generated filament networks. Error bars denote 95% confidence interval.
Figure 6
Figure 6
Individual filament stress values in nodal equilibrium for 138 filaments, 16 perimeter nodes, and 30 internal nodes after a network was stretched uniaxially by 10% for (a) 1, (b) 5, (c) 10, and (d) 25 cycles. Positive stress (i.e., tension) denotes an increase in the length of the filament relative to the length before the stretching cycle and negative stress (i.e., compression) denotes a decrease in length. At the end of each cycle, filament breakage probability was defined to be the absolute value of the strain normalized to the largest strain value.
Figure 7
Figure 7
Histogram of filament stresses in nodal equilibrium after (a) 1, (b) 5, (c) 10, (d) 25 iterative cycles of 10% uniaxial stretch averaged over 10 uniquely generated filament networks of 138 filaments, 16 perimeter nodes, and 30 internal nodes. The starred (*) leftmost and rightmost bins contain filaments with stresses less or greater than −180 and 180 MPa, respectively. Positive stress (i.e., tension) denotes an increase in the length of the filament relative to that before each stretching cycle and negative stress (i.e., compression) denotes a decrease in length. Note the large rightmost bin in Figure 7(a) represents a large number of high-stress filaments initially present in the network, which decreases with additional cycles (Fig. 7(b–d)). Error bars denote 95% confidence interval.
Figure 8
Figure 8
Images of NIH 3T3 fibroblasts exposed to 1 Hz vertical cyclic stretch uniaxial stretching after (a) 3, (b) 6, (c) 12, (d) 24 hours. Red lines indicate representative actin filaments measured for angle relative to stretch direction. (e) Average filament angle relative to stretch direction at all time points. 5 filament angles were measured per clearly visible non-dividing cell. For the 3, 6, 12, 24 hour time points, we measured filaments in 47, 31, 22, and 10 cells, respectively. The cells were cultured on an elastomeric substrate, stretched, fixed with paraformaldahyde, and then stained with 6 µM Alexa Flour® 488 phalloidin stain for F-actin. These images were captured on an inverted Zeiss Axiovert optical microscope with a 63X high numerical aperture oil immersion objective. A fluorescein isothiocyanate (FITC) filter set allowed us to visualize the actin filaments. Error bars denote 95% confidence interval.
Figure 9
Figure 9
Angular orientation histogram of NIH 3T3 fibroblasts after (a) 3, (b) 6, (c) 12, and (d) 24 hours of uniaxial horizontal cyclic stretch. Following mechanical stimulation, the cells were stained for F-actin and fluorescent images were imported into ImageJ software for analysis of actin filament orientation. Microfilament orientation was examined by fitting an ellipse to the cellular outline based upon an initial tracing of the cell periphery. A major and minor x' and y' axes was then defined on this ellipse. Actin filament orientation was then quantified by comparing the ellipse major axis orientation to the direction of uniaxial stretch. Only cells whose actin filaments exhibited a single orientation were used for analysis. 100 cells were sampled.

References

    1. Alberts B. Molecular biology of the cell. 4th edit. New York: Garland Science; 2002.
    1. Bausch AR, Kroy K. A bottom-up approach to cell mechanics. Nat Phys. 2006;2(4):231–238.
    1. Cano ML, Lauffenburger DA, Zigmond SH. Kinetic analysis of F-actin depolymerization in polymorphonuclear leukocyte lysates indicates that chemoattractant stimulation increases actin filament number without altering the filament length distribution. J Cell Biol. 1991;115(3):677–687. - PMC - PubMed
    1. Chen CS, Alonso JL, Ostuni E, Whitesides GM, Ingber DE. Cell shape provides global control of focal adhesion assembly. Biochem Biophys Res Commun. 2003;307(2):355–361. - PubMed
    1. Chu JW, Voth GA. Coarse-grained modeling of the actin filament derived from atomistic-scale simulations. Biophys J. 2006;90(5):1572–1582. - PMC - PubMed

Publication types

LinkOut - more resources