. 2011 Apr;1812(4):480-7.
doi: 10.1016/j.bbadis.2011.01.005. Epub 2011 Jan 15.

Biliverdin reductase--a protein levels and activity in the brains of subjects with Alzheimer disease and mild cognitive impairment

Affiliations

Biliverdin reductase--a protein levels and activity in the brains of subjects with Alzheimer disease and mild cognitive impairment

Eugenio Barone et al. Biochim Biophys Acta. 2011 Apr.

Abstract

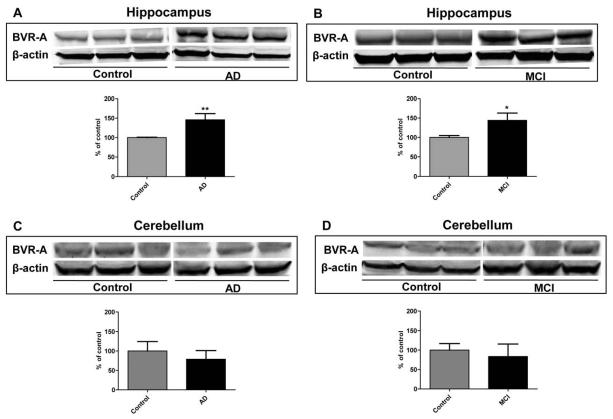
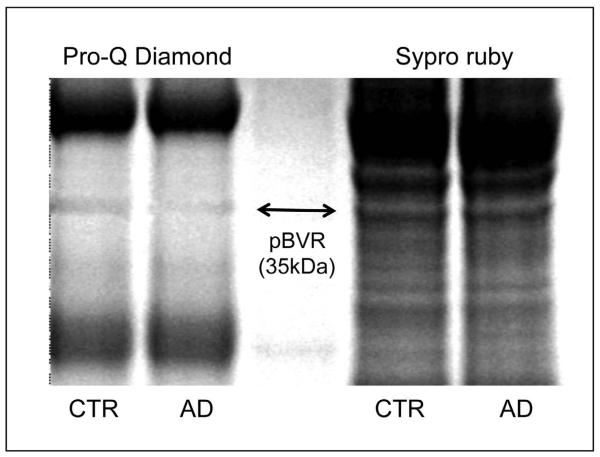
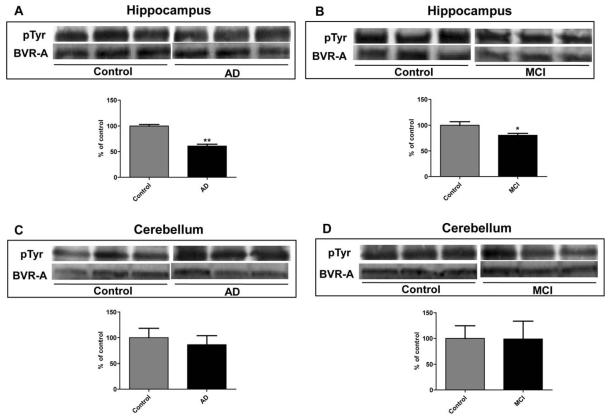
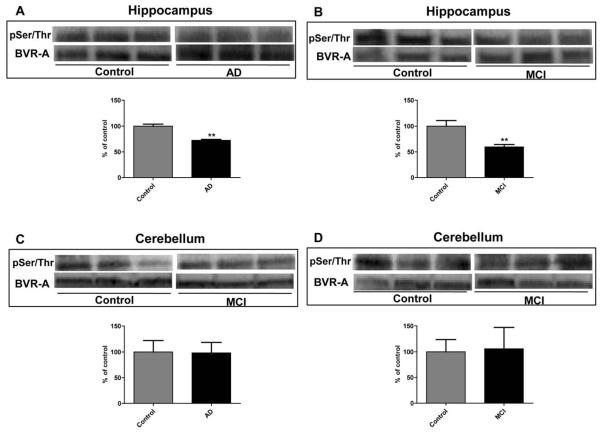
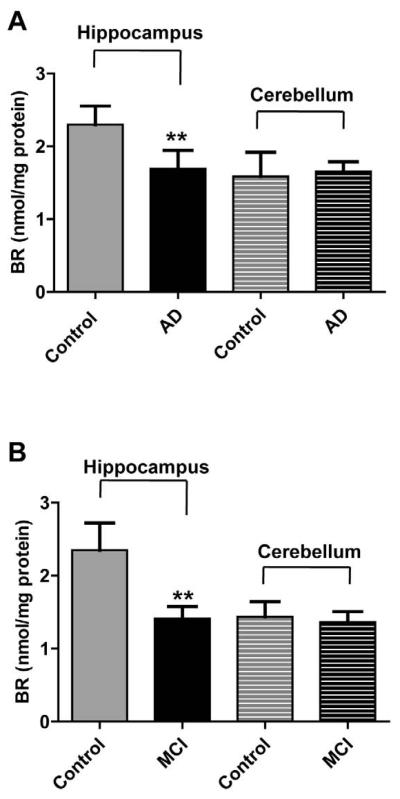
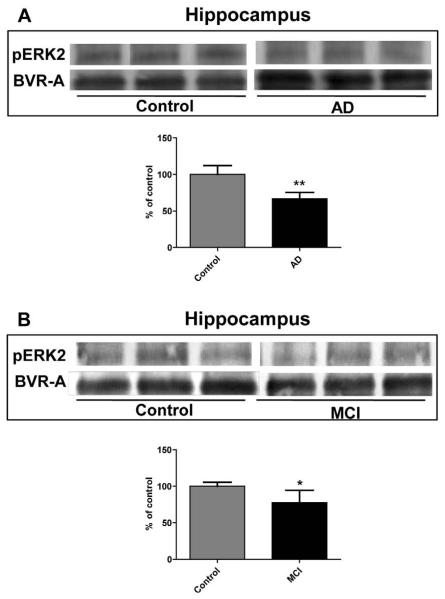
Biliverdin reductase-A is a pleiotropic enzyme involved not only in the reduction of biliverdin-IX-alpha into bilirubin-IX-alpha, but also in the regulation of glucose metabolism and cell growth secondary to its serine/threonine/tyrosine kinase activity. Together with heme oxygenase, whose metabolic role is to degrade heme into biliverdin-IX-alpha, it forms a powerful system involved in the cell stress response during neurodegenerative disorders. In this paper, an up-regulation of the biliverdin reductase-A protein levels was found in the hippocampus of the subjects with Alzheimer disease and arguably its earliest form, mild cognitive impairment. Moreover a significant reduction in the phosphorylation of serine, threonine and tyrosine residues of biliverdin reductase-A was found, and this was paralleled by a marked reduction in its reductase activity. Interestingly, the levels of both total and phosphorylated biliverdin reductase-A were unchanged as well as its enzymatic activity in the cerebella. These results demonstrated a dichotomy between biliverdin reductase-A protein levels and activity in the hippocampus of subjects affected by Alzheimer disease and mild cognitive impairment, and this effect likely is attributable to a reduction in the phosphorylation of serine, threonine and tyrosine residues of biliverdin reductase-A. Consequently, not just the increased levels of biliverdin reductase-A, but also its changed activity and phosphorylation state, should be taken into account when considering potential biomarkers for Alzheimer disease and mild cognitive impairment.


Figures

Figure 1
Figure 1
Biliverdin reductase-A (BVR-A) protein levels in hippocampus and cerebellum of Alzheimer diseases (AD) and mild cognitive impairment (MCI) subjects. Brain samples of hippocampus (panels A and B) and cerebellum (panels C and D) of subjects with AD or MCI were assayed for BVR-A by Western Blot as described under Materials and Methods (section 2.4). Densitometric values shown in the histograms are given as percentage of Control, set as 100%, and are the product of the band value of the levels of BVR-A normalized per β-actin as loading control. In panels A-D representative gels are shown. Data are expressed as mean ± SD of six individual samples per group. *P < 0.05 and **P < 0.01 versus Control (Student's t-test).
Figure 2
Figure 2
Biliverdin reductase-A total phosphorylation levels in hippocampus of Alzheimer disease (AD) subjects. Representative 1D gel image of immunoprecipitated BVR-A stained for total phosphorylation (Pro-Q Diamond) and for protein levels level (Sypro Ruby) in control and AD hippocampus.
Figure 3
Figure 3
Biliverdin reductase-A (BVR-A) phosphorylation on Tyrosine (Tyr) residues in hippocampus and cerebellum of Alzheimer diseases (AD) and mild cognitive impairment (MCI) subjects. Brain samples of hippocampus (panels A and B) and cerebellum (panels C and D) of subjects with AD or MCI were immunoprecipitated by using an anti-BVR-A antibody and assayed for phospho-Tyr (pTyr) by Western Blot as described under Materials and Methods (sections 2.4, 2.5 and 2.7). Densitometric values shown in the histograms are given as percentage of Control, set as 100%, and are the product of the band value of the levels of pTyr-BVR-A normalized per total BVR-A as loading control. In panels A-D representative gels are shown. Data are expressed as mean ± SD of six individual samples per group. *P < 0.05 and **P < 0.01 versus Control (Student's t-test).
Figure 4
Figure 4
Biliverdin reductase-A (BVR-A) phosphorylation on Serine/Threonine (Ser/Thr) residues in hippocampus and cerebellum of Alzheimer diseases (AD) and mild cognitive impairment (MCI) subjects. Brain samples of hippocampus (panels A and B) and cerebellum (panels C and D) of subjects with AD or MCI were immunoprecipitated by using an anti-BVR-A antibody and assayed for phospho-Ser/Thr (pSer/Thr) by Western Blot as described under Materials and Methods (sections 2.4, 2.5 and 2.7). Densitometric values shown in the histograms are given as percentage of Control, set as 100%, and are the product of the band value of the levels of pSer/Thr-BVR-A normalized per total BVR-A as loading control. In panels A-D representative gels are shown. Data are expressed as mean ± SD of six individual samples per group. **P < 0.01 versus Control (Student's t-test).
Figure 5
Figure 5
Biliverdin reductase activity in hippocampus and cerebellum of Alzheimer diseases (AD) and mild cognitive impairment (MCI) subjects. Brain samples of hippocampus (panels A and B) and cerebellum (panels C and D) of subjects with AD or MCI were assayed for BVR activity as described under Materials and Methods (section 2.8). Values are given as nmol of bilirubin (BR) formed per mg of protein. Data are expressed as mean ± SD of six individual samples per group. ** P < 0.01 versus Control (Student's t-test).
Figure 6
Figure 6
Extracellular signal-regulated kinases 1/2 (ERK 1/2) phosphorylation in hippocampus of Alzheimer diseases (AD) and mild cognitive impairment (MCI) subjects. Brain samples of hippocampus (panels A and B) of subjects with AD or MCI were immunoprecipitated with anti-BVR-A antibody and assayed for phospho-ERK1/2 by Western Blot as described under Materials and Methods (sections 2.4 and 2.5). Densitometric values shown in the histograms are given as percentage of Control, set as 100%, and are the product of the band value of the levels of pERK 2 normalized per total BVR-A as loading control. In panels A-B representative gels are shown. Data are expressed as mean ± SD of six individual samples per group. *P<0.05 and **P < 0.01 versus Control (Student's t-test).

References

    1. Butterfield DA, Stadtman ER. Paula ST, Bittar EE, editors. Protein Oxidation Processes in Aging Brain. Advances in Cell Aging and Gerontology. 1997:161–191.
    1. Calabrese V, Cornelius C, Mancuso C, Barone E, Calafato S, Bates T, Rizzarelli E, Kostova AT. Vitagenes, dietary antioxidants and neuroprotection in neurodegenerative diseases. Front. Biosci. 2009;14:376–397. - PubMed
    1. Mancuso C, Scapagini G, Curro D, Giuffrida Stella AM, De Marco C, Butterfield DA, Calabrese V. Mitochondrial dysfunction, free radical generation and cellular stress response in neurodegenerative disorders. Front. Biosci. 2007;12:1107–1123. - PubMed
    1. Poon HF, Calabrese V, Scapagnini G, Butterfield DA. Free radicals: key to brain aging and heme oxygenase as a cellular response to oxidative stress. J. Gerontol. A Biol. Sci. Med. Sci. 2004;59:478–493. - PubMed
    1. Maines MD. The heme oxygenase system: a regulator of second messenger gases. Annu. Rev. Pharmacol. Toxicol. 1997;37:517–554. - PubMed

Publication types

MeSH terms

Substances