

Cortical thickness correlates of specific cognitive performance accounted for by the general factor of intelligence in healthy children aged 6 to 18
- PMID: 21241809
- PMCID: PMC3070152
- DOI: 10.1016/j.neuroimage.2011.01.016
Cortical thickness correlates of specific cognitive performance accounted for by the general factor of intelligence in healthy children aged 6 to 18
Abstract
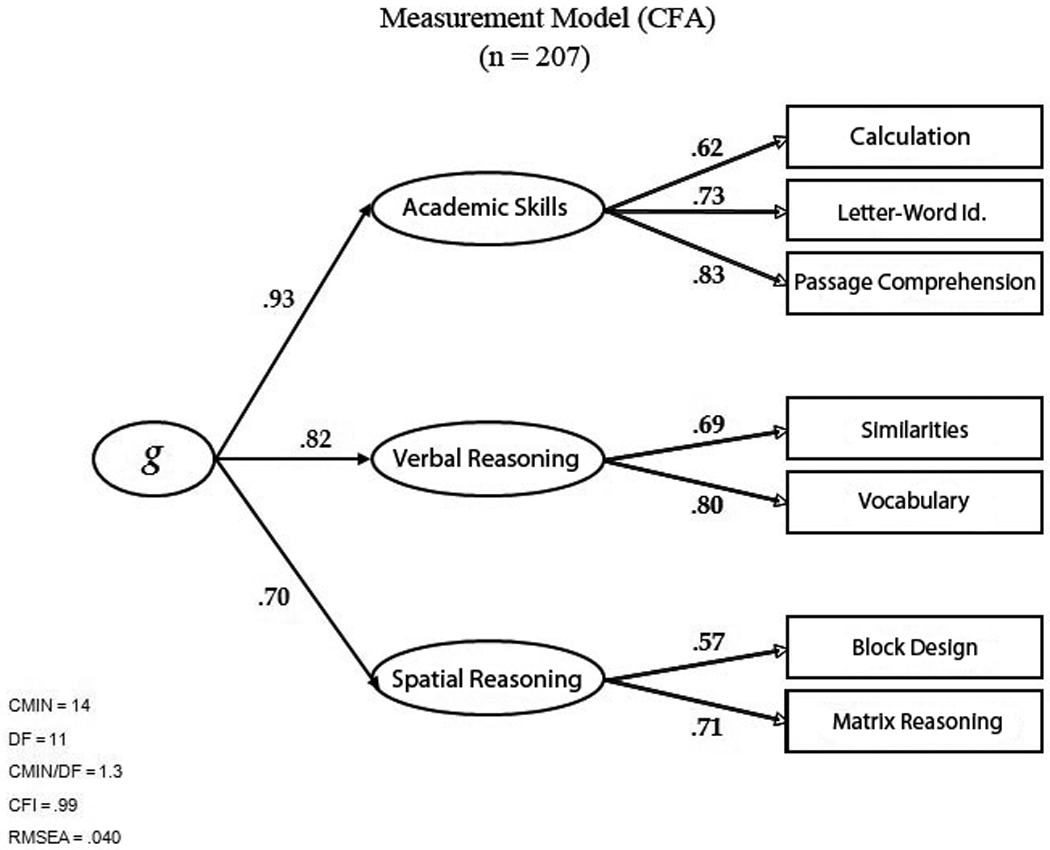
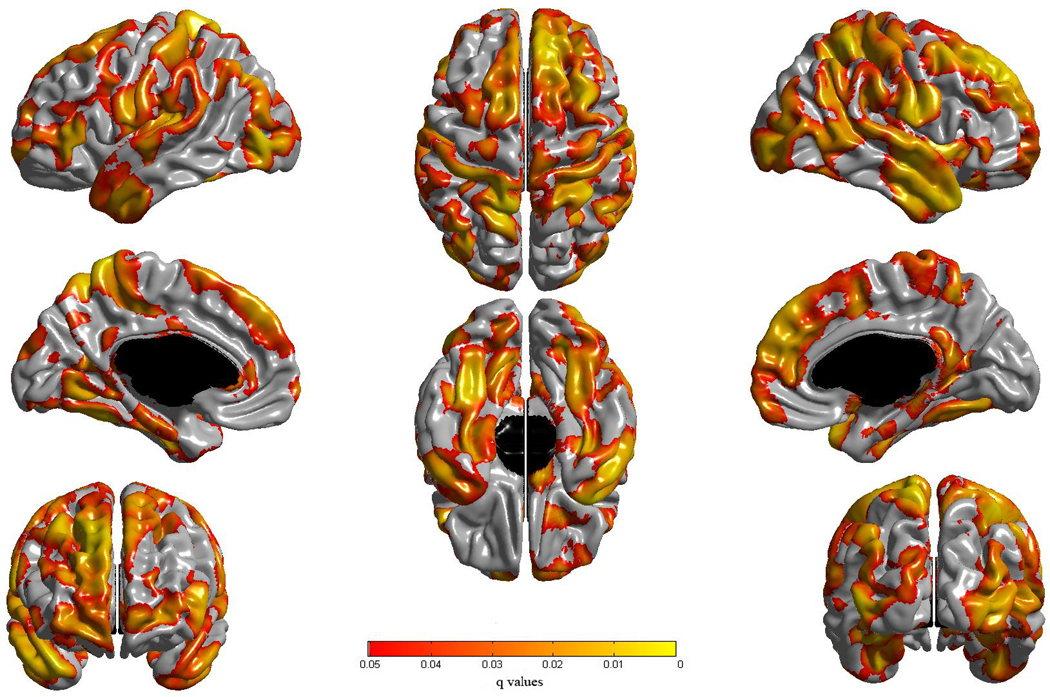
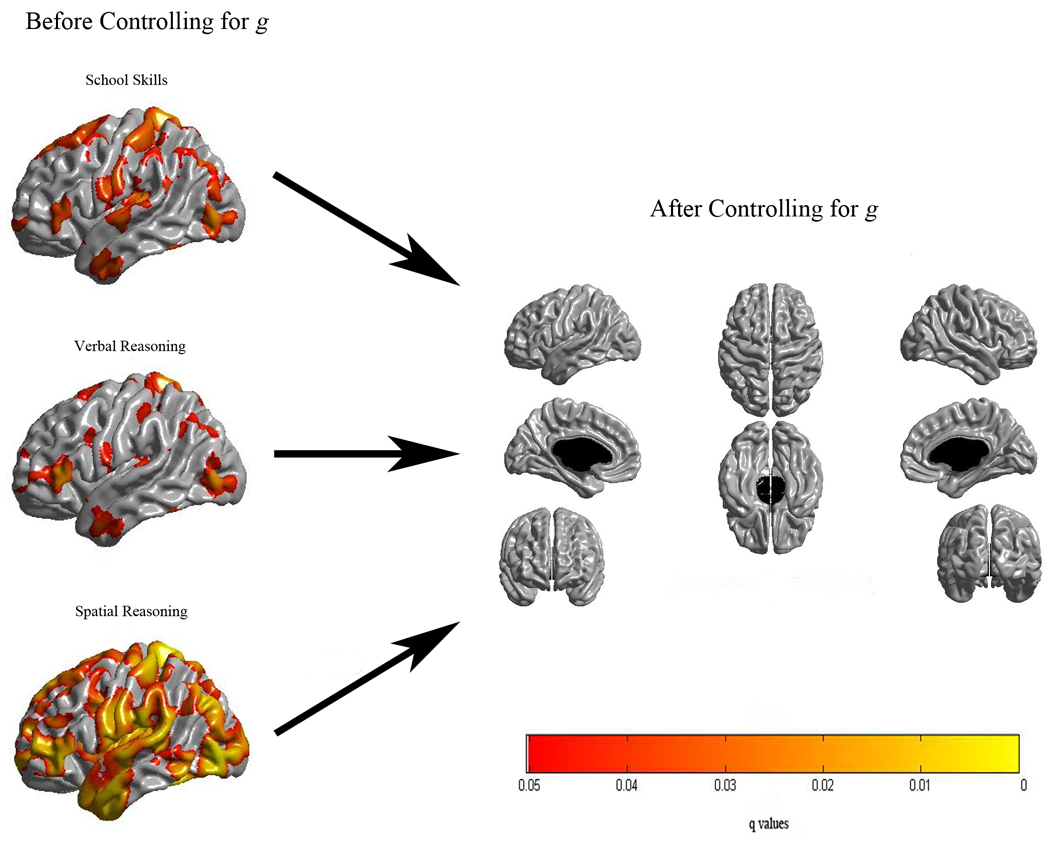
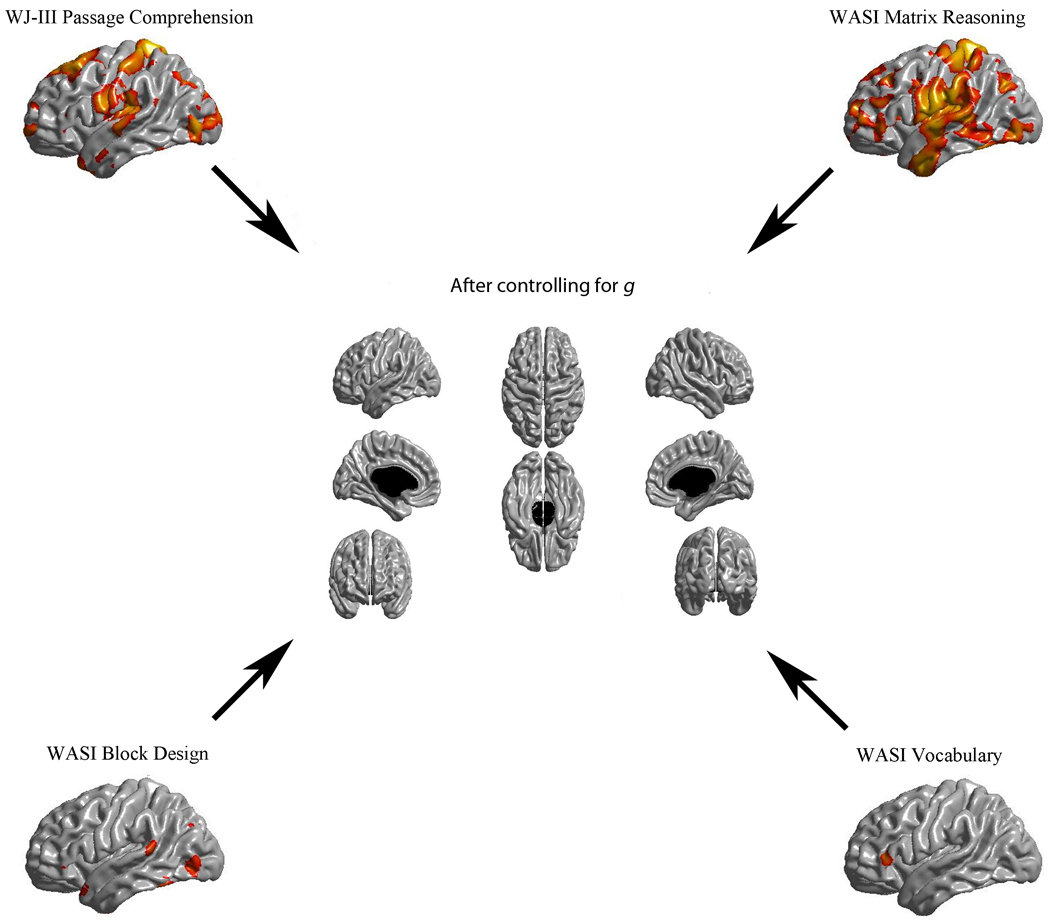
Prevailing psychometric theories of intelligence posit that individual differences in cognitive performance are attributable to three main sources of variance: the general factor of intelligence (g), cognitive ability domains, and specific test requirements and idiosyncrasies. Cortical thickness has been previously associated with g. In the present study, we systematically analyzed associations between cortical thickness and cognitive performance with and without adjusting for the effects of g in a representative sample of children and adolescents (N=207, Mean age=11.8; SD=3.5; Range=6 to 18.3 years). Seven cognitive tests were included in a measurement model that identified three first-order factors (representing cognitive ability domains) and one second-order factor representing g. Residuals of the cognitive ability domain scores were computed to represent g-independent variance for the three domains and seven tests. Cognitive domain and individual test scores as well as residualized scores were regressed against cortical thickness, adjusting for age, gender and a proxy measure of brain volume. g and cognitive domain scores were positively correlated with cortical thickness in very similar areas across the brain. Adjusting for the effects of g eliminated associations of domain and test scores with cortical thickness. Within a psychometric framework, cortical thickness correlates of cognitive performance on complex tasks are well captured by g in this demographically representative sample.
Copyright © 2011 Elsevier Inc. All rights reserved.
Figures
References
-
- Ad-Dab'bagh Y, Lyttelton O, Muehlboeck J-S, Lepage C, Einarson D, Mok K, Ivanov O, Vincent RD, Lerch J, Fombonne E, Evans AC. The CIVET Image-Processing Environment: A Fully Automated Comprehensive Pipeline for Anatomical Neuroimaging Research. In: Corbetta M, editor. Proceedings of the 12th Annual Meeting of the Organization for Human Brain Mapping; Florence, Italy. 2006. p. S45.
-
- Andreasen NC, Flaum M, Swayze V, 2nd, O'Leary DS, Alliger R, Cohen G, Ehrhardt J, Yuh WT. Intelligence and brain structure in normal individuals. Am J Psychiatry. 1993;150:130–134. - PubMed
-
- Benjamini Y, Hochberg Y. Controlling the False Discovery Rate: A Practical and Powerful Approach to Multiple Testing. Journal of the Royal Statistical Society, Series B (Methodological) 1995;57:289–300.
-
- Bollen KA. Structure Equations with Latent Variables. New York: John Wiley & Sons; 1989.
Publication types
MeSH terms
Grants and funding
LinkOut - more resources
Full Text Sources
Other Literature Sources
Medical
