. 2011 Jan 21;144(2):282-95.
doi: 10.1016/j.cell.2010.12.029.

RIM proteins tether Ca2+ channels to presynaptic active zones via a direct PDZ-domain interaction

Affiliations

RIM proteins tether Ca2+ channels to presynaptic active zones via a direct PDZ-domain interaction

Pascal S Kaeser et al. Cell. .

Abstract

At a synapse, fast synchronous neurotransmitter release requires localization of Ca(2+) channels to presynaptic active zones. How Ca(2+) channels are recruited to active zones, however, remains unknown. Using unbiased yeast two-hybrid screens, we here identify a direct interaction of the central PDZ domain of the active-zone protein RIM with the C termini of presynaptic N- and P/Q-type Ca(2+) channels but not L-type Ca(2+) channels. To test the physiological significance of this interaction, we generated conditional knockout mice lacking all multidomain RIM isoforms. Deletion of RIM proteins ablated most neurotransmitter release by simultaneously impairing the priming of synaptic vesicles and by decreasing the presynaptic localization of Ca(2+) channels. Strikingly, rescue of the decreased Ca(2+)-channel localization required the RIM PDZ domain, whereas rescue of vesicle priming required the RIM N terminus. We propose that RIMs tether N- and P/Q-type Ca(2+) channels to presynaptic active zones via a direct PDZ-domain-mediated interaction, thereby enabling fast, synchronous triggering of neurotransmitter release at a synapse.


Figures

Figure 1
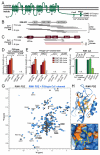
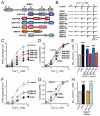
Figure 1. Direct interaction of P/Q- and N-type Ca2+-channels with RIM PDZ-domains
A. Structure of the α1-subunits of P/Q- and N-type Ca2+-channels. Following the 4 × 6 transmembrane regions (I-IV), P/Q-type and N-type Ca2+-channels contain a C-terminal cytoplasmic tail with conserved SH3-domain binding sequences (PxxP), PNGY motifs, and C-terminal sequence motifs (DxWC). B & C, Summary of the RIM-BP (B) and RIM prey clones (C) isolated in yeast two-hybrid screens with the C-terminal sequences of N- and P/Q-type Ca2+-channels. D-F, Liquid yeast-two hybrid assays with baits containing wild-type C-terminal sequence of the P/Q-type Ca2+-channel and the three indicated RIM prey clones (D); baits containing the C-terminal sequence of the N-type Ca2+-channel without or with point mutations in the PxxP (PxxPM) or the PNGY sequence (PNGYM), or with a deletion of the 4 C-terminal residues (ΔCterm), and the indicated RIM prey clones (E); and baits containing the indicated RIM1 domains (PDZ, PDZ-domain only; C2A or C2B, C2A- or C2B-domains only; C2AB, both C2-domains and the intercalated PxxP motif) and preys consisting of the wild-type C-terminal sequence of the N-type Ca2+-channel (F, left bars), or the indicated mutants of this Ca2+-channel (F, right bars). For all assays, pLexN served as a control; a.u. = arbitrary units; n.d. = not detectable (means ± SEMs). G, Analysis of P/Q-type Ca2+-channel binding to the RIM1 PDZ-domain by NMR spectroscopy. 1H-15N HSQC spectra of the 15N-labeled RIM1 PDZ-domain (38 μM) were acquired in the absence (black contours) and presence (blue contours) of unlabeled P/Q-peptide (0.1 mM). Selected cross-peak assignments from residues on the periphery of the binding site are indicated; cross-peaks from three lysine residues in the binding pocket that shift upon peptide binding are labeled in bold, underlined typeface (K651, K653 and K694). H, Model of the RIM1 PDZ-domain (blue ribbon diagram) bound to the six C-terminal residues of the P/Q-type Ca2+-channel peptide represented as a stick model with color-coded atoms (carbon, yellow; oxygen, red; nitrogen, blue; sulfur, orange). Strand βB and helix αB, the two structural elements that line the peptide-binding site (Lu et al., 2005), are indicated. I, Close-up view the surface of the RIM1 PDZ-domain peptide-binding pocket with the bound P/Q-type Ca2+-channel peptide (colors are identical to panel H). For additional 1H-15N HSQC spectra and affinity measurements by isothermal titration calorimetry, see Figure S1.
Figure 2
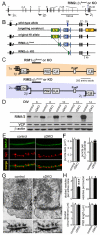
Figure 2. Conditional deletion of RIM proteins in mice
A, Structure of the RIM2 gene (a.k.a. Rims2). Exons are shown as black boxes and numbered, positions of exons containing the initiator codons for RIM2α, RIM2β and RIM2γ are labeled 1’, 1” and 1’”, respectively. The first exon that is shared by all RIM2 isoforms (exon 26) was used for gene targeting in the conditional RIM2αβγ KO mice (shaded blue area). B, RIM2αβγ targeting strategy. The diagram shows (from top to bottom) an expanded map of the RIM2 gene surrounding exon 26; the targeting vector (C = ECFP-tetracysteine tag in exon 26; blue triangles = loxP sites; N = neomycin resistance cassette; green circles = frt recombination sites; DT = diphtheria toxin gene cassette); the knockin allele (KI); the RIM2αβγfloxed allele (neomycin resistance cassette was removed by flp-recombination); and the KO allele (cre recombination deleted exon 26, creating a non-translated, unstable mRNA). C, Domain structures of RIM1α, 1β, 2α, 2β, and 2γ that are deleted in the RIM1/RIM2 conditional double KO neurons. Coils surrounding the N-terminal Zn2+-finger domain (Zn) signify Rab3-binding sequences. D, Representative immunoblots of RIM1 and RIM2 proteins in cultured hippocampal neurons from RIM1/RIM2 double conditional KO mice infected with lentiviruses expressing inactive (control) or active cre-recombinase (cDKO). Neurons were infected on DIV3, and analyzed at the indicated times (DIV6-DIV14). E, Representative images of cDKO and control neurons stained with antibodies to MAP2 (green) and synapsin (red). Scale bar = 5 μm, applies to all images. F, Quantitations of the size and density of synapses analyzed as shown in E (control, n=18 neurons/3 independent cultures; cDKO neurons, 17/3). G, Electron micrographs of osmium tetroxide- (top) or phosphotungstic acid-stained (bottom) control and cDKO neurons (scale bars, 200 nm). H, Quantitations of synaptic ultrastructure in electron micrographs. Docked vesicles are defined as vesicles touching the plasma membrane. Data in F and H show means ± SEMs. Statistical significance by Student’s t-test : ***, p<0.001.; for additional detailed information, see Fig. S2 and Table S1.
Figure 3
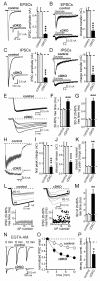
Figure 3. RIM deletion decreases, decelerates, and desynchronizes neurotransmitter release
A & B, Excitatory synaptic responses in cultured hippocampal control and cDKO neurons evoked by an action potential (A) or hypertonic sucrose application (B) (left, representative traces; right, summary graphs of amplitudes and charges; A: control, n=8 neurons/3 independent neuronal cultures; cDKO, n=9/3, B: control, n=9/3; cDKO, n=10/3). C & D, Inhibitory synaptic responses evoked by an action potential (C) or hypertonic sucrose application (D) (C: control, n=21/4; cDKO, n=18/4; D: control, n=11/3; cDKO, n=11/3). E-G, Analysis of the kinetics of isolated IPSCs (E, representative traces from control and cDKO neurons; F, 20-80% IPSC rise times; and G, rise time variability as expressed by the standard deviation (SD) of the 20-80% rise time [control, n=31/6; cDKO, n=36/6]). H-K, Synaptic responses elicited by 10 Hz stimulus train in cDKO and control neurons (H, representative IPSCs; I-K, summary graphs of the synaptic charge transfer for the first IPSC (I) and for delayed release (J; release starting 100 ms after the last stimulus), and of the ratio of delayed release/first response (K; control, n=20/4; cDKO, n=21/4). L & M, Analysis of the kinetics of IPSCs during 10 Hz stimulus trains (L, representative traces for the first 10 IPSCs during a 10 Hz stimulus train [top, first response indicated as a thick line, later responses represented as thin lines], and 20-80% rise times for three sample trains [bottom]; M, standard deviation (SD) of the 20-80% rise times during the 10 Hz stimulus train as a measure of synchrony; control, n=7/3; cDKO, n=9/3). N-P, Time course of the decrease in IPSCs induced by addition of the membrane-permeable Ca2+-chelator EGTA-AM (10 μM; N, sample traces; O, summary graphs; P, decay time constants; control, n=8/3; cDKO, n=9/3). Decay time constants τ were calculated by fitting individual experiments to a single exponential function. All data are means ± SEMs; *, p<0.05, **, p<0.01, ***, p<0.001 as determined by Student’s t-test. Numerical values of electrophysiology results are in Table S2, further analysis of synaptic responses at elicited at 10 Hz in Fig. S3).
Figure 4
Figure 4. Mutational dissection of RIM KO phenotype
A, Diagram of RIM rescue proteins expressed in cDKO neurons via an IRES sequence from the same mRNA as cre-recombinase. The single-letter code above the RIM1α diagram identifies the various domains (R, Rab3-binding α-helical region; Z, Zn-finger region, P, PDZ-domain; A, C2A-domain; S, proline-rich SH3-binding PxxP motif; B, C2B-domain); H marks the presence of a human influenza hemagglutinin (HA)-tag. B, Representative traces of IPSCs evoked at the indicated extracellular Ca2+-concentrations [Ca2+]ex in control neurons, cDKO neurons without rescue, cDKO neurons with full-length RIM1α rescue, and cDKO neurons with rescue with the RIM-RZ or the RIM-PASB fragments. Each rescue experiment was performed with independent control groups. C-K, Summary plots of absolute (C, F, and I) and normalized IPSC amplitudes (D, G, and J; normalized to the 10 mM [Ca2+]ex response) evoked at the indicated [Ca2+]ex, and summary graphs of the Ca2+-dependence of release (E, H, and K; expressed as the [Ca2+]ex producing a half-maximal IPSC amplitude (EC50), as determined by fitting in individual experiments the [Ca2+]ex-dependence of the IPSC amplitude (Figs. D, G, J) to a Hill function). Control neurons and cDKO neurons were analyzed in comparison with cDKO neurons rescued with RIM1α (C-E), RIM-RZ (F-H), or RIM-PASB (I-K). C, D: n = 8 neurons/3 independent batches of culture in control, 6/3 in cDKO, 9/3 in cDKO + RIM1α; E, F: n = 7/3 in control, 7/3 in cDKO, 7/3 in cDKO + RIM-RZ; G, H: n = 6/3 in control, 5/3 in cDKO, 8/3 in cDKO + RIM-PASB. L & M, Summary graphs of 20-80% rise times (L) and rise time variability (M) for the indicated rescue experiments at 2 mM [Ca2+]ex (for sample traces, see Fig. S4O, n = see Fig. 4C-4K). Data shown are means ± SEMs, ***, p<0.001 by one-way ANOVA, detailed statistical analysis for all data points can be found in Table S3. For Ca2+-cooperativity and Imax, see Fig. S4.
Figure 5
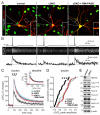
Figure 5. RIM deletion decreases presynaptic Ca2+-transients
A, Representative fluorescence images of control neurons, cDKO neurons, and cDKO neurons rescued with the C-terminal RIM-PASB fragment. Neurons were filled via a patch pipette with Fluo5F and Alexa594 (red); nuclear EGFP-fluorescence (produced by the active and inactive cre-recombinase EGFP-fusion proteins; see Figs. S5A-S5C) is shown in green; and coincident Alexa594 and EGFP- or Fluo5F signals are shown in yellow). Insets (bottom right) show areas in dotted rectangles containing a sample axonal bouton (grey lines = positions of the patch pipette; white lines = position of line scans for the Ca2+-transients shown in B). Scale bar (bottom left) = 20 μm. B, Representative action potentials (top); line scans of Ca2+-transients in presynaptic boutons induced by these action potentials, and monitored via Fluo5F fluorescence (middle; colored white for better visibility); and quantitations of Ca2+-transients (bottom; averaged across the bouton). C & D, Summary plots of action potential-induced changes in Ca2+-indicator fluorescence monitored in presynaptic boutons from control neurons, cDKO neurons, and cDKO neurons rescued with the C-terminal RIM-PASB fragment (C, time course of the Ca2+-indicator fluorescence (inset: the same plot for dendrites); D, the cumulative probability of the peak Ca2+-indicator fluorescence, expressed as ΔG/G0). Data in C are means (line) ± SEMs (shaded area); ***, p<0.001 as assessed by two-way ANOVA for peak amplitudes during the first 60 ms after action potential induction (C) or by Kolmogorov-Smirnov test (D); control, n=45 boutons/10 neurons/4 independent cultures; cDKO, n=46/11/4; cDKO + RIM-PASB, n=44/11/4. E, Immunoblot analysis of Ca2+-channel subunit levels in control and cDKO neurons. Blots were probed with antibodies to the indicated Ca2+-channel proteins (P/Q-type (CaV2.1-A and CaV2.1-S) and N-type (CaV2.2) α-subunits, and α2/δ and β4 subunits) and control proteins (GDI, GDP-dissociation inhibitor). For analysis of dendritic Ca2+-transients, statistical values, and quantitative assessment of mRNA levels, see Fig. S5 and Table S4.
Figure 6
Figure 6. RIM PDZ-domain and PxxP-motif confer normal Ca2+-dependence to RIM-deficient synapses
A, Domain structures of rescue proteins. B, Sample traces of IPSCs in control neurons, cDKO neurons, and cDKO neurons rescued with the indicated proteins. C-E, Systematic rescue analyses of the Ca2+-dependence of release in RIM-deficient cDKO neurons with RIM fragments containing three of the four RIM domains present in the RIM-PASB fragment. Absolute IPSC amplitudes (C), IPSC amplitudes normalized to the response at 10 mM [Ca2+]ex (D), and apparent Ca2+-affinities (EC50 values; E) are indicated (control, n=9 cells/3 independent batches of cultures; cDKO, n=9/3: cDKO+RIM-ASB, n=9/3; cDKO+RIM-PSB, n=8/3; cDKO+RIM-PAB, n=8/3; cDKO+RIM-PAS, n=10/3). F-H, Rescue analyses of the Ca2+-dependence of release with RIM fragments containing either only the PDZ-domain and PxxP-motif (RIM-PS), or only the C2A- and C2B-domains (RIM-AB) of RIM1 (control, n=8/3; cDKO, n=7/3; cDKO+RIM-PS, n=9/3; cDKO+RIM-AB, n=9/3). Data shown are means ± SEMs; ***, p<0.001 by one-way ANOVA. Cooperative factor n, and Imax can be found in Fig. S6, all numerical data are in Table S5.
Figure 7
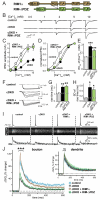
Figure 7. RIM function in localizing presynaptic Ca2+-influx requires its PDZ-domain
A, Domain structures of rescue proteins. B-E, Sample traces and quantitative analysis of Ca2+-dependence of release of IPSCs in control neurons, cDKO neurons, and cDKO neurons rescued with the PDZ-domain deficient RIM-ΔPDZ fragment. Absolute IPSC amplitudes (C), IPSC amplitudes normalized to the response at 10 mM [Ca2+]ex (D), and apparent Ca2+-affinities (EC50 values; E) are indicated (control, n=10/3; cDKO, n=9/3: cDKO+RIM-ΔPDZ, n= 10/3). F-H, Speed and synchrony of neurotransmitter release in control neurons, cDKO neurons and cDKO neurons rescued with RIM-ΔPDZ (control, n=7/3; cDKO, n=10/3: cDKO+RIM-ΔPDZ, n=12/3). I and J, Sample line scans (I) and summary data (J) of action potential evoked Ca2+-transients in presynaptic boutons of control neurons, cDKO neurons and cDKO neurons rescued with RIM1α or RIM-ΔPDZ. Data shown are means (line) ± SEMs (shaded area). (boutons: control, n=40 boutons/6 neurons/5 independent cultures; cDKO, n=57/7/5; cDKO+RIM1α, n=51/7/5, cDKO+RIM-ΔPDZ, n=52/7/5; dendrites: control, n=22/6/5; cDKO, n=22/7/5; cDKO+RIM1α, n=19/7/5, cDKO+RIM-ΔPDZ, n=22/7/5). For cumulative peak amplitudes and statistical values, see Fig. S7 and Table S6). Statistical analyses: *, p<0.05; **, p<0.01; ***, p<0.001; E, G and H, one-way ANOVA ; J, two-way ANOVA for peak amplitudes during the first 60 ms after action potential induction.
Figure 8
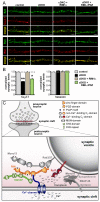
Figure 8. RIM-dependent Ca2+-channel tethering linked to synaptic vesicle docking and priming
A and B, Immunofluorescent stainings (A) and quantitative immuno-localization analyses (B) of P/Q-type Ca2+-channels (top panel in A) and presynaptic bassoon (bottom panel in A) in control and RIM-deficient cDKO neurons, and in cDKO neurons rescued with RIM1α or RIM-ΔPDZ (n=3 cultures per condition, *, p<0.05; **, p<0.01 by Student’s t-test compared to control, a second, independent experiment is found in Fig. S8 and Table S7). C, Model of the presynaptic release machinery. The drawing illustrates the structures of major active zone proteins (RIMs, Munc13s, and RIM-BPs), P/Q- or N-type Ca2+-channels, a partially assembled SNARE-complex (composed of synaptobrevin/VAMP on synaptic vesicles and SNAP-25 and syntaxin-1 on the plasma membrane), Munc18-1, complexin, and key synaptic vesicle proteins (Rab3 and synaptotagmin-1 [Syt1]). Domain identification is provided on the top right. We propose that RIMs determine the specific localization of P/Q- and N-type Ca2+-channels at the active zone via a direct Ca2+-channel/PDZ-domain interaction, and via indirect binding of Ca2+-channels to RIMs via RIM-BPs (Hibino et al., 2002). In addition, RIMs form an N-terminal priming complex with Rab3 and Munc13, in which Munc13 likely acts by binding to SNARE complexes (not depicted due to restrictions of the 2-dimensional presentation). Synaptotagmin-1 on the vesicles serves as the Ca2+-sensor for exocytosis. With this architecture, Ca2+-channels and Ca2+-sensors are in close proximity, accounting for the speed, synchrony and extent of release.

Comment in

  • The multiple faces of RIM.
    Pernía-Andrade A, Jonas P. Pernía-Andrade A, et al. Neuron. 2011 Jan 27;69(2):185-7. doi: 10.1016/j.neuron.2011.01.010. Neuron. 2011. PMID: 21262457

References

    1. Atasoy D, Schoch S, Ho A, Nadasy KA, Liu X, Zhang W, Mukherjee K, Nosyreva ED, Fernandez-Chacon R, Missler M, et al. Deletion of CASK in mice is lethal and impairs synaptic function. Proc Natl Acad Sci U S A. 2007;104:2525–2530. - PMC - PubMed
    1. Betz A, Thakur P, Junge HJ, Ashery U, Rhee JS, Scheuss V, Rosenmund C, Rettig J, Brose N. Functional interaction of the active zone proteins Munc13-1 and RIM1 in synaptic vesicle priming. Neuron. 2001;30:183–196. - PubMed
    1. Castillo PE, Schoch S, Schmitz F, Sudhof TC, Malenka RC. RIM1alpha is required for presynaptic long-term potentiation. Nature. 2002;415:327–330. - PubMed
    1. Castillo PE, Weisskopf MG, Nicoll RA. The role of Ca2+ channels in hippocampal mossy fiber synaptic transmission and long-term potentiation. Neuron. 1994;12:261–269. - PubMed
    1. Catterall WA, Perez-Reyes E, Snutch TP, Striessnig J. International Union of Pharmacology. XLVIII. Nomenclature and structure-function relationships of voltage-gated calcium channels. Pharmacol Rev. 2005;57:411–425. - PubMed

Publication types

MeSH terms