. 2011 Jan 21;144(2):296-309.
doi: 10.1016/j.cell.2011.01.004.

Densely interconnected transcriptional circuits control cell states in human hematopoiesis

Affiliations

Densely interconnected transcriptional circuits control cell states in human hematopoiesis

Noa Novershtern et al. Cell. .

Abstract

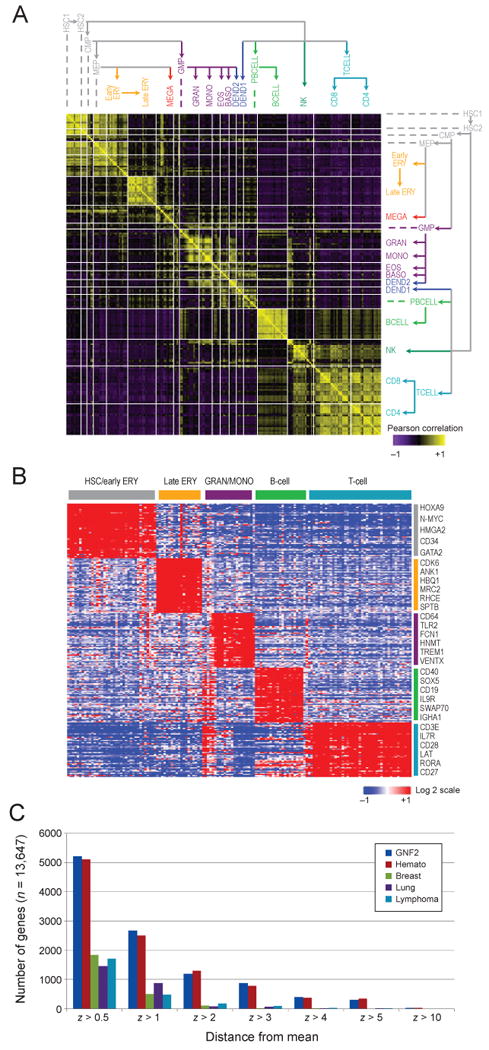
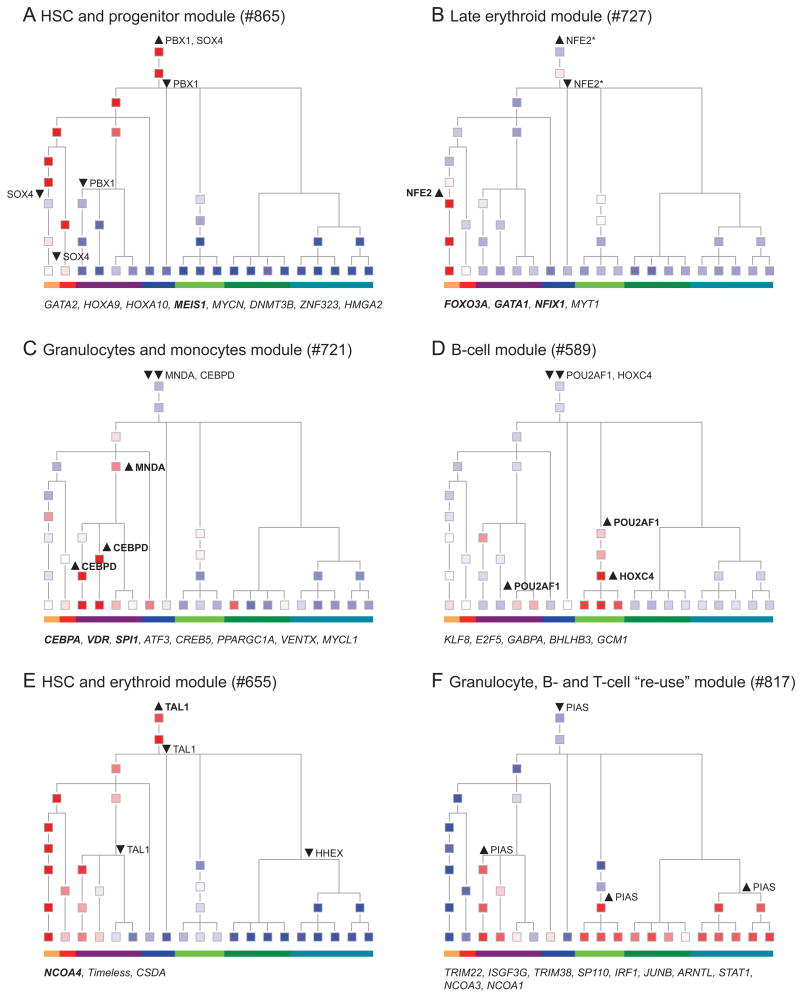
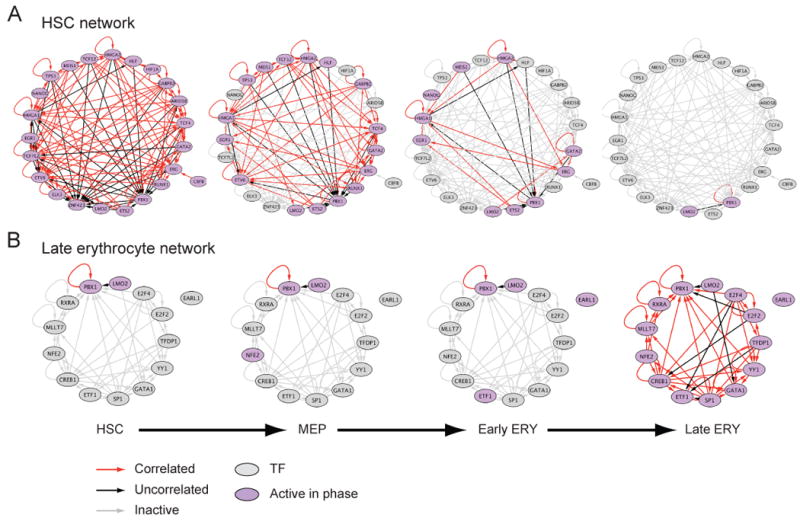
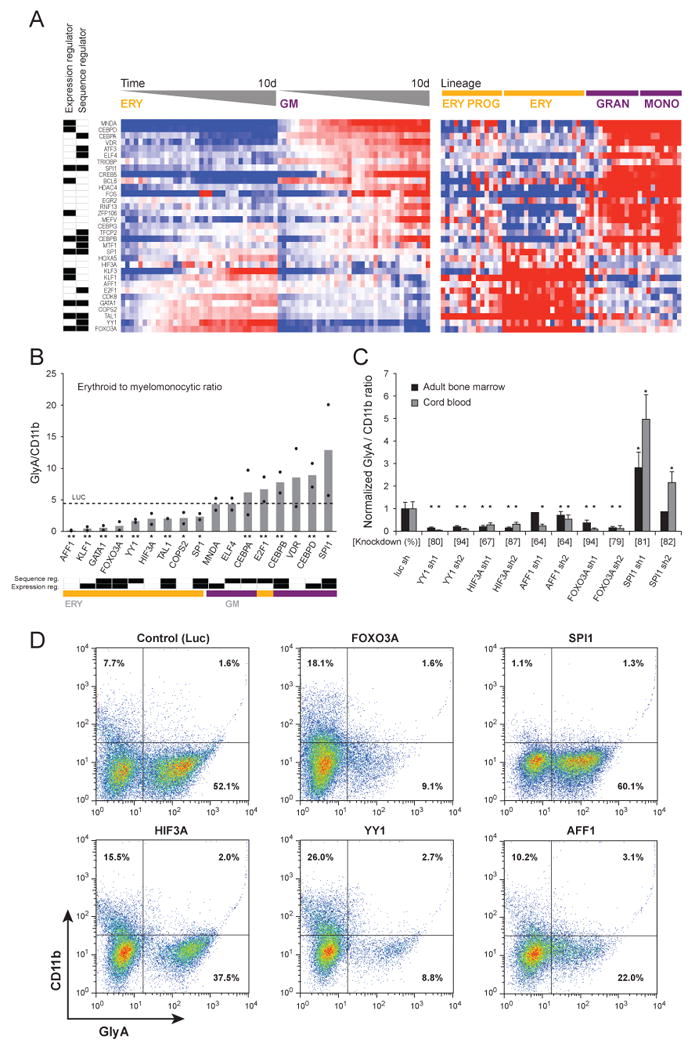
Though many individual transcription factors are known to regulate hematopoietic differentiation, major aspects of the global architecture of hematopoiesis remain unknown. Here, we profiled gene expression in 38 distinct purified populations of human hematopoietic cells and used probabilistic models of gene expression and analysis of cis-elements in gene promoters to decipher the general organization of their regulatory circuitry. We identified modules of highly coexpressed genes, some of which are restricted to a single lineage but most of which are expressed at variable levels across multiple lineages. We found densely interconnected cis-regulatory circuits and a large number of transcription factors that are differentially expressed across hematopoietic states. These findings suggest a more complex regulatory system for hematopoiesis than previously assumed.


Figures

Figure 1
Figure 1. Hematopoietic differentiation
The 38 hematopoietic cell populations purified by flow sorting and analyzed by gene expression profiling are illustrated in their respective positions in hematopoiesis. Grey - hematopoietic stem cell (HSC1,2), common myeloid progenitor (CMP), megakaryocyte/erythroid progenitor (MEP); Orange - erythroid cells (ERY1-5); Red – CFU-MK (MEGA1) and megakaryocyte (MEGA2); Purple - granulocyte/monocyte progenitor (GMP), CFU-G (GRAN1), neutrophilic metamyelocyte (GRAN2), neutrophil (GRAN3), CFU-M (MONO1), monocytes (MONO2), eosinophil (EOS), and basophil (BASO); Blue - myeloid dendritic cell (DENDa2) and plasmacytoid dendritic cell (DENDa1); Light green - early B-cell (Pre-BCELL2), pro-B-cell (Pre-BCELL3), naïve B-cell (BCELLa1), mature B-cell, class able to switch (BCELLa2), mature B-cell (BCELLa3), and mature B-cell, class switched (BCELLa4); Dark green - mature NK cell (NK1-4); Turquoise - naïve CD8+ T-cell (TCELL2), CD8+ effector memory RA (TCELL1), CD8+ effector memory (TCELL3), CD8+ central memory (TCELL4), naïve CD4+ T-cell (TCELL6), CD4+ effector memory (TCELL7), and CD4+ central memory (TCELL8). See Table S1 for markers information.
Figure 2
Figure 2. A transcriptional map of hematopoietic differentiation identifies lineage specific transcription
(A) Similarity in global expression profiles between proximate differentiation states. The heat map shows the pair-wise Pearson correlation coefficients between all 211 samples, ordered according to the differentiation tree (right and top). A positive correlation is portrayed in yellow and a negative correlation in purple. (B) Signature genes characterizing the five main lineages. Expression levels are shown for the top 50 marker genes (rows) for each of four major lineages plus hematopoietic stem and progenitor cells. High relative expression is shown in red, and low relative expression in blue; the expression of each gene is normalized to a mean expression of zero across all the samples; labels as in Figure 1. Genes were selected by high expression in one lineage compared to the others (t-test). (C) The number of genes that are differentially expressed, according to an outlier statistic, was calculated for all hematopoietic cell states profiled (red), a compendium of 79 tissues in the GNF atlas (Su et al., 2004) (blue) and datasets of lymphomas (Monti et al., 2005) (turquoise), lung cancers (Bhattacharjee et al., 2001) (purple), and breast cancers (Chin et al., 2006) (green). See also Figure S1.
Figure 3
Figure 3. Expression pattern and functional enrichment of 80 transcriptional modules
(A) Average expression levels of 80 gene modules. Shown is the average expression pattern of the gene members in each of the 80 modules (rows) across all 211 samples (columns). Colors and normalization as in Figure 2B. The samples are organized according to the differentiation tree topology (top) with abbreviations as in Figure 1. The number of genes in each module is shown in the bar graph (left). The expression profiles of a few example modules discussed in the text are highlighted by vertical yellow lines. The expression of individual genes in each module is shown in Figure S2. (B) Functional enrichment in gene modules. Functional categories with enriched representation (FDR < 5%) in at least one module are portrayed. Categories were selected for broad representation. The complete list appears in Table S3. See also Figures S2 and S7.
Figure 4
Figure 4. Propagation and transitions in modules' expression along hematopoiesis
Shown are the mean expression levels of the module's genes in each cell state (colored squares), and selected changes in the predicted regulators, as highlighted in the text (upward arrowhead – regulator induced; downward arrowhead – regulator repressed). Member genes (rather than regulators) in each module encoding TFs are noted below each module, as these may reflect alternative regulators at the same differentiation points. TFs that were validated as regulators of erythroid or granulocyte/monocyte differentiation in a functional assay (Figure 7) are highlighted in bold. The color bar at the bottom of each tree denotes the key lineages, as in Figure 1. (A) HSC and progenitor expression in Module 865; (B) Lineage specific induction in late erythrocytes in Module 727; (C) Lineage specific induction in granulocytes and monocytes in Module 721; (D) Lineage specific induction in B cells in Module 589; (E) One-sided propagation of induced state from HSC to the erythroid lineage in Module 655. (F) Re-use of Module 817, which is inactive in HSCs and independently induced in both lymphoid cells and granulocytes. See also Figures S3 and S4.
Figure 5
Figure 5. Dynamic organization of tightly integrated cis-regulatory circuits in HSCs and erythroid cells
(A,B) Shown are cis-regulatory networks between TFs (nodes) that are enriched in at least one gene-set, and are expressed (fold-change > 1.5) in (A) HSCs or (B) late erythroid cells. Nodes represent TFs that are active (purple) or non-active (grey) in each of the 4 phases of the erythroid lineage (HSC, MEP, Early ERY, Late ERY). An edge from node a to node b indicates that the promoter of the gene in node b has a binding site for the TF encoded by the gene in node a. Edge colors indicate the Pearson correlation between the expression profiles of the TFs in the connected nodes: red – positive correlation (coefficient > 0.4), black – no correlation (absolute Pearson ≤ 0.4), grey – non-active edge (at least one of the two connected nodes was not expressed in that phase). See Table S4 for enriched motif information.
Figure 6
Figure 6. Lineage specific regulation of TF expression
Signature TF genes with lineage-specific expression in the five main lineages. Shown are the expression levels of the top 50 marker TF genes (rows) selected for each of four major lineages plus hematopoietic stem and progenitor cells (labels as in Figure 1). Genes were selected by high expression in one lineage compared to the others (t-test). High expression is shown in red, and low expression in blue; the expression of each gene is normalized to a mean expression of zero across all the samples. See also Figures S5 and S6.
Figure 7
Figure 7. Experimental validation of 33 TFs
(A) The expression of 33 TFs was detected in primary human bone marrow CD34+ progenitor cells undergoing differentiation in vitro, harvested at 12 time points between days 3 to 10 of differentiation, and detected by a multiplexed assay using LMA followed by fluorescent bead-based detection (left heat map). In the heat map in the right panel, the expression of the same TFs in the original Affymetrix dataset is illustrated. The labels at the far left indicate whether the TF was chosen as a regulator in the expression-based model or in the sequence-based model. (B) Differentiation following TF silencing with shRNA. Human bone marrow CD34+ cells expressing shRNAs targeting TFs were induced to differentiate in-vitro for 10 days, and the ratio of erythroid (glycophorin A positive) and myelomonocytic (CD11b positive) cells was measured by flow cytometry. Each black dot represents an individual shRNA (mean of three replicates), and bars indicate their average. The effect of a control shRNA targeting the luciferase gene, which is not expressed in human cells, is indicated with a dashed line. Below the shRNA labels, * or ** indicates p < .05 for one or both shRNAs, respectively. Bottom – classification of the TFs according to their roles in the expression-based and sequence-based models, and to their induction pattern in the LMA profiling. (C) The effects of additional shRNAs targeting candidate TFs expressed in CD34+ cells derived from both umbilical cord blood and adult bone marrow and assayed as in panel B (* indicates p < .01). (D) Representative flow cytometry scatter plots from shRNAs expressed in umbilical cord blood. See additional information in Tables S5, S6 and S7.

Comment in

References

    1. Akashi K. Lineage promiscuity and plasticity in hematopoietic development. Ann N Y Acad Sci. 2005;1044:125–131. - PubMed
    1. Amit I, Garber M, Chevrier N, Leite AP, Donner Y, Eisenhaure T, Guttman M, Grenier JK, Li W, Zuk O, et al. Unbiased Reconstruction of a Mammalian Transcriptional Network Mediating Pathogen Responses. Science %R 101126/science1179050. 2009;326:257–263. - PMC - PubMed
    1. Aplan PD, Nakahara K, Orkin SH, Kirsch IR. The SCL gene product: a positive regulator of erythroid differentiation. EMBO J. 1992;11:4073–4081. - PMC - PubMed
    1. Aramburu J, Azzoni L, Rao A, Perussia B. Activation and expression of the nuclear factors of activated T cells, NFATp and NFATc, in human natural killer cells: regulation upon CD16 ligand binding. J Exp Med. 1995;182:801–810. - PMC - PubMed
    1. Argiropoulos B, Yung E, Humphries RK. Unraveling the crucial roles of Meis1 in leukemogenesis and normal hematopoiesis. Genes Dev. 2007;21:2845–2849. - PubMed

Publication types

Substances

Associated data