. 2011 May 1;17(9):2934-46.
doi: 10.1158/1078-0432.CCR-10-1803. Epub 2011 Jan 17.

Prediction of postoperative recurrence-free survival in non-small cell lung cancer by using an internationally validated gene expression model

Affiliations

Prediction of postoperative recurrence-free survival in non-small cell lung cancer by using an internationally validated gene expression model

Ranjana Mitra et al. Clin Cancer Res. .

Abstract

Purpose: This study was performed to discover prognostic genomic markers associated with postoperative outcome of stage I to III non-small cell lung cancer (NSCLC) that are reproducible between geographically distant and demographically distinct patient populations.

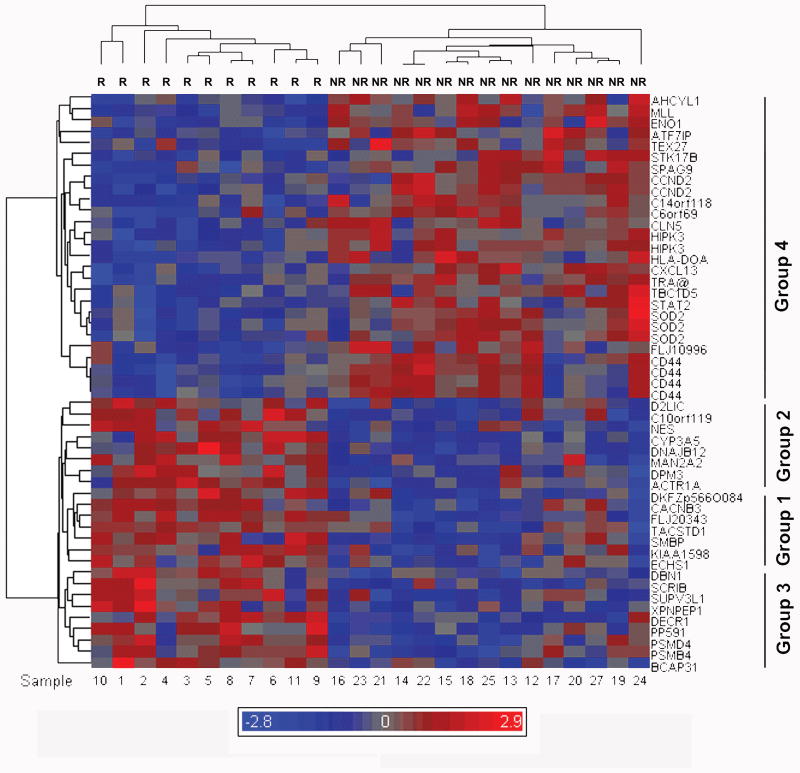
Experimental design: American patients (n = 27) were stratified on the basis of recurrence and microarray profiling of their tumors was performed to derive a training set of 44 genes. A larger Korean patient validation cohort (n = 138) was also stratified by recurrence and screened for these genes. Four reproducible genes were identified and used to construct genomic and clinicogenomic Cox models for both cohorts.

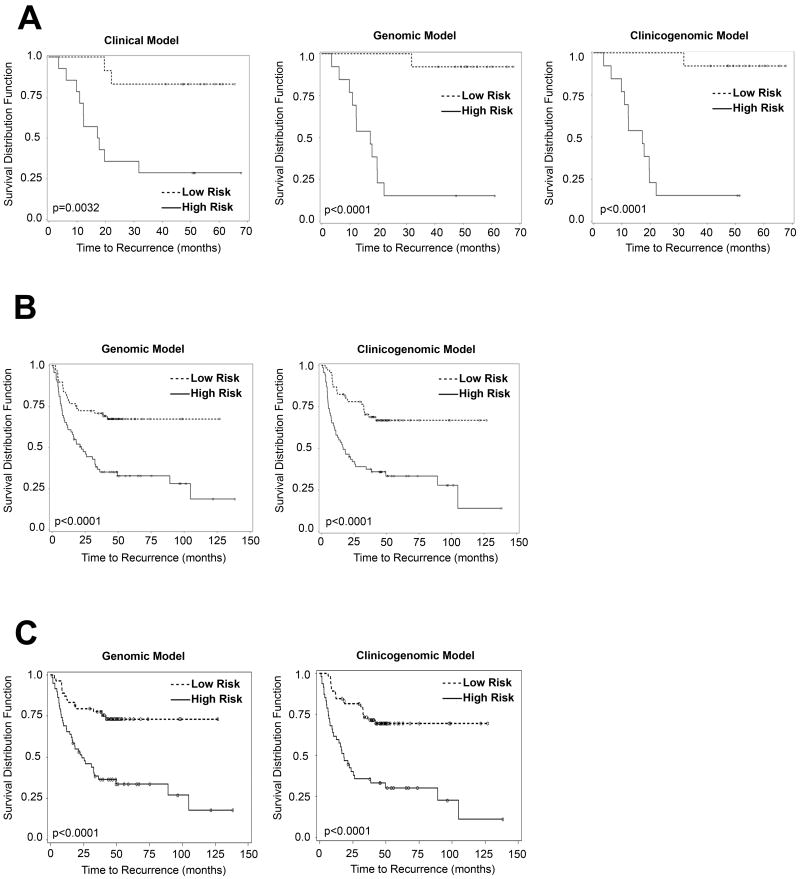
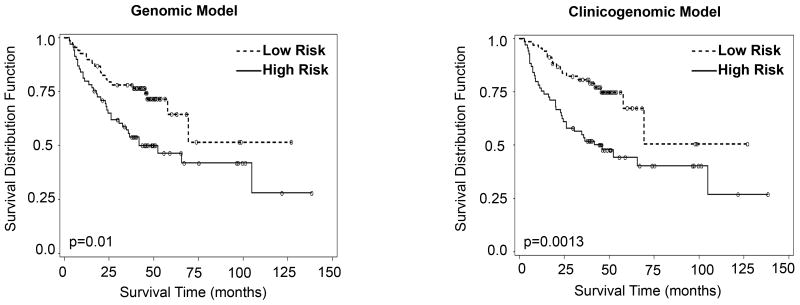
Results: Four genomic markers, DBN1 (drebrin 1), CACNB3 (calcium channel beta 3), FLAD1 (PP591; flavin adenine dinucleotide synthetase), and CCND2 (cyclin D2), exhibited highly significant differential expression in recurrent tumors in the training set (P < 0.001). In the validation set, DBN1, FLAD1 (PP591), and CACNB3 were significant by Cox univariate analysis (P ≤ 0.035), whereas only DBN1 was significant by multivariate analysis. Genomic and clinicogenomic models for recurrence-free survival (RFS) were equally effective for risk stratification of stage I to II or I to III patients (all models P < 0.0001). For stage I to II or I to III patients, 5-year RFS of the low- and high-risk patients was approximately 70% versus 30% for both models. The genomic model for overall survival of stage I to III patients was improved by addition of pT and pN stage (P < 0.0013 vs. 0.010).

Conclusion: A 4-gene prognostic model incorporating the multivariate marker DBN1 exhibits potential clinical utility for risk stratification of stage I to III NSCLC patients.


Figures

Figure 1
Figure 1. Gene expression profile and hierarchical clustering separating the recurrent and non-recurrent groups on the basis of discriminatory genes
Twenty six evaluable tumors were clustered hierarchically on the basis of 51 probes corresponding to 44 genes, using Partek ® Genomics Suite v6.3. The dendrograms of individual patient samples and overall patterns of gene expression data are exhibited. The recurrent group is labeled R and non-recurrent NR. Individual tumor specimen numbers are indicated at the bottom of the figure and the tumor specimen dendrogram is given along the top. Gene symbols are indicated on the right side of the figure and relatedness of gene expression is indicated by the dendrogram on the left side of the figure. The clustering is of log2 transformed Affymetrix MAS5 signals. Red color indicates increased expression and blue color lower, relative to the mean level of gene expression, indicated in grey. The color scale indicates the mean log2 expression level above (red) and below (blue) the mean of all genes (grey), over a range of 2.9 log2 units above and below the mean.
Figure 2
Figure 2
A. Clinical, genomic and clinicogenomic RFS models of training cohort (stage I-III patients). The clinical model is: Cox score = Histology (-16.12716 × Squamous - 1.03510 × other) + 0.95865 × pStage + 0.22791 × Gender + Race (-0.57444 × African American - 0.95745 × Undetermined); the genomic model is: Cox score = -713.79613 × DBN1 -1090 × CCND2 + 668.28496 × CACNB3 + 383.51066 × PP591; and the clinicogenomic model is: Cox score = -1218 × DBN1 - 2072 × CCND2 + 1710 × CACNB3 + 507.39229 × PP591 + Histology (-14.22074 × Squamous - 2.78616 × other) + 0.60136 × pStage + 1.40561 × gender + Race (-3.16002 × Black - 3.44106 × Undetermined). The cutoffs (i.e. median Cox scores) for the clinical, genomic and clinicogenomic models were 1.18655, -30.8891 and -45.2830, respectively. Time to recurrence is expressed in months; number of patients: 27. B. Genomic and clinicogenomic RFS models of validation cohort (stage I-III patients). The genomic model is: Cox score = 0.38040 × DBN1 + 0.30160 × CACNB3 - 0.93964 × CCND2 + 0.28898 × FLAD1; the clinicogenomic model is: Cox score = pT stage (0.58862 × T2+2.19489 × T3+0.31153 × T4) + pN stage (0.75430 × N1+1.24674 × N2) + 0.56392 × DBN1 + 0.43517 × CACNB3 - 0.61023 × CCND2 + 0.39543 × FLAD1. The median Cox scores for the genomic and clinicogenomic models were 3.66 and 7.43, respectively. Time to recurrence is expressed in months; number of patients: 138. The clinical model for this set of patients has been previously published (11). C. Genomic and clinicogenomic RFS models of validation cohort (stage I-II patients). The genomic model is: Cox score = 0.37488 × DBN1 + 0.47831 × CACNB3 - 0.98259 × CCND2 + 0.33511 × FLAD1; the clinicogenomic model is: Cox score = pT stage (0.82325 × T2 + 2.78736 × T3) + 1.02786 × pN stage + 0.54254 × DBN1 + 0.46196 × CACNB3 - 0.99139 × CCND2 + 0.36875 × FLAD1. Time to recurrence is expressed in months; number of patients: 112.
Figure 3
Figure 3. Genomic and clinicogenomic disease-specific OS models of validation cohort (stage I-III patients)
The genomic model is: Cox score = 0.39443 × DBN1 + 0.13635 × CACNB3 - 0.77471 × CCND2 + 0.28103 × FLAD1; the clinicogenomic model is: Cox score = pT stage (1.03717 × pT2+2.34391 × pT3+0.69257 × pT4) + pN stage (0.54998 × pN1+1.22555 × pN2) + 0.48697 × DBN1 + 0.25821 × CACNB3 - 0.69815 × CCND2 + 0.32732 × FLAD1. Overall survival is expressed in months; number of patients: 138.

References

    1. Zhu CQ, Ding K, Strumpf D, et al. Prognostic and predictive gene signature for adjuvant chemotherapy in resected non-small-cell lung cancer. J Clin Oncol. 2010;28:4417–24. - PMC - PubMed
    1. Beer DG, Kardia SL, Huang CC, et al. Gene-expression profiles predict survival of patients with lung adenocarcinoma. Nat Med. 2002;8:816–24. - PubMed
    1. Chen G, Gharib TG, Wang H, et al. Protein profiles associated with survival in lung adenocarcinoma. Proc Natl Acad Sci U S A. 2003;100:13537–42. - PMC - PubMed
    1. Raponi M, Zhang Y, Yu J, et al. Gene expression signatures for predicting prognosis of squamous cell and adenocarcinomas of the lung. Cancer Res. 2006;66:7466–72. - PubMed
    1. Yanagisawa K, Tomida S, Shimada Y, Yatabe Y, Mitsudomi T, Takahashi T. A 25-signal proteomic signature and outcome for patients with resected non-small-cell lung cancer. J Natl Cancer Inst. 2007;99:858–67. - PubMed

Publication types

MeSH terms