Review
. 2011 Feb 27;366(1564):528-39.
doi: 10.1098/rstb.2010.0248.

Remapping for visual stability

Affiliations
Review

Remapping for visual stability

Nathan J Hall et al. Philos Trans R Soc Lond B Biol Sci. .

Abstract

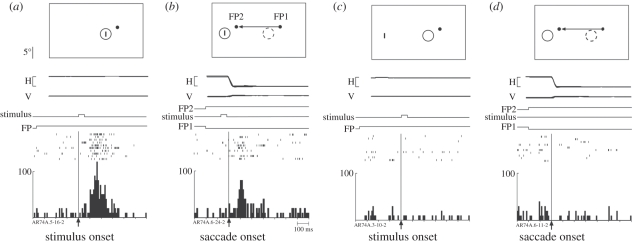
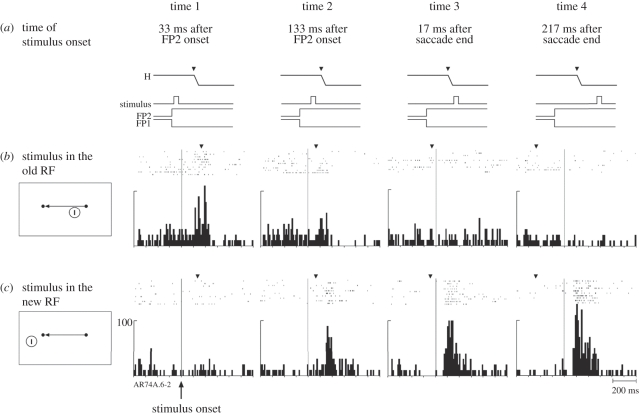
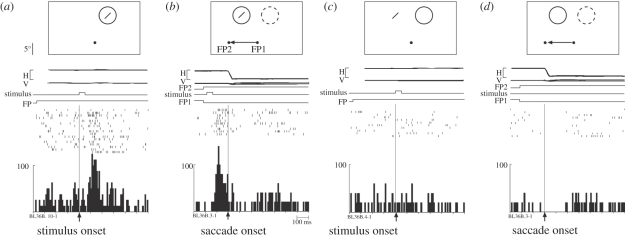
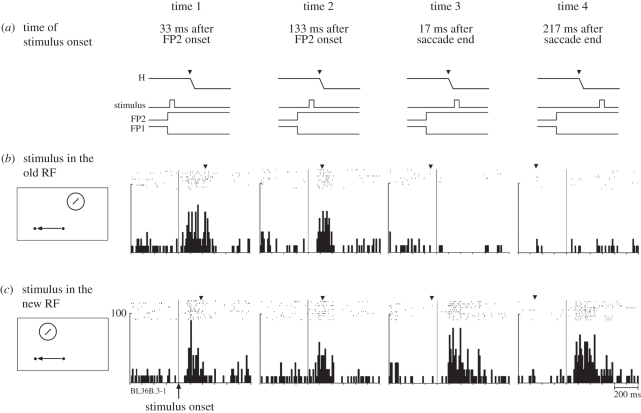
Visual perception is based on both incoming sensory signals and information about ongoing actions. Recordings from single neurons have shown that corollary discharge signals can influence visual representations in parietal, frontal and extrastriate visual cortex, as well as the superior colliculus (SC). In each of these areas, visual representations are remapped in conjunction with eye movements. Remapping provides a mechanism for creating a stable, eye-centred map of salient locations. Temporal and spatial aspects of remapping are highly variable from cell to cell and area to area. Most neurons in the lateral intraparietal area remap stimulus traces, as do many neurons in closely allied areas such as the frontal eye fields the SC and extrastriate area V3A. Remapping is not purely a cortical phenomenon. Stimulus traces are remapped from one hemifield to the other even when direct cortico-cortical connections are removed. The neural circuitry that produces remapping is distinguished by significant plasticity, suggesting that updating of salient stimuli is fundamental for spatial stability and visuospatial behaviour. These findings provide new evidence that a unified and stable representation of visual space is constructed by redundant circuitry, comprising cortical and subcortical pathways, with a remarkable capacity for reorganization.


Figures

Figure 1.
Figure 1.
A V3A neuron that responds to the stimulus trace after a saccade. The cartoons show the locations of the stimulus (small vertical bar) and the receptive field. Time lines in each panel show horizontal and vertical eye position for 10 trials (calibration bar 20°) and timing of task events (calibration bar 100 ms). Rasters from 10 correct trials are aligned on the events specified and summed to generate histograms. (a) Fixation task. The stimulus is flashed on for 50 ms in the receptive field (RF) while the monkey maintains fixation on the fixation point (FP). (b) Single-step task. The stimulus is flashed for 50 ms while the monkey fixates FP1. FP1 is extinguished at the same time that FP2 appears. The monkey makes a saccade to FP2. This saccade moves the RF from its original position (dashed circle) to a new position (solid circle). Note that the stimulus is extinguished before the eye reaches FP2, so that no physical stimulus ever appears in either the old or the new RF. The neuron responds to the memory trace of the stimulus. (c) Stimulus-only control. The neuron does not respond to a stimulus presented outside the RF. (d) Saccade-only control. The saccade alone does not drive the neuron. Saccade target distance, size and location of RF are drawn to scale. Adapted from Nakamura & Colby [3].
Figure 2.
Figure 2.
Timing of remapping in a V3A neuron (same neuron as figure 1). The time lines (a) show when the stimulus was presented relative to the saccade. The stimulus was presented either in the old receptive field (b) or in the new receptive field (c). All eight trial types were randomly interleaved. The data are aligned on stimulus onset. The average time of the saccade is indicated by the inverted triangle above each set of rasters. The response to a stimulus in the old RF (b) is reduced when the stimulus is presented immediately before the saccade (time 2). The neuron also responds to a stimulus in the new (future) RF (c) at time 2, even though there is no physical stimulus on the screen by the time the eye reaches the new FP. The neuron is responding to the updated memory trace of the stimulus. Adapted from Nakamura & Colby [3].
Figure 3.
Figure 3.
Predictive remapping in V3A. This neuron responds even before the saccade when a stimulus is flashed in the new RF. Same format as figure 1. (a) Fixation task. Visual response to 50 ms stimulus flashed in the RF. (b) Single-step task. The same stimulus is flashed for 50 ms at the future location of the RF. The neuron responds even before the beginning of the saccade that will bring the stimulated location into the RF, as though the RF had already shifted in anticipation. No physical stimulus ever appears in either the old or the new RF. (c) Stimulus-only control. The neuron does not respond to a stimulus presented outside the RF. (d) Saccade-only control. The saccade alone does not drive the neuron. Adapted from Nakamura & Colby [3].
Figure 4.
Figure 4.
Timing of remapping for a predictive V3A neuron (same neuron as figure 3). The time lines (a) show when the stimulus was presented relative to the saccade. The stimulus was presented either in the old receptive field (b) or in the new receptive field (c). All eight trial types were randomly interleaved. The data are aligned on stimulus onset. The average time of the saccade is indicated by the inverted triangle above each set of rasters. This predictive neuron responds to a stimulus at either the old or new RF location when the stimulus is presented either long before the saccade (time 1) or immediately before the saccade (time 2). This dual sensitivity ends abruptly at the time of the saccade (times 3 and 4). Adapted from Nakamura & Colby [3].
Figure 5.
Figure 5.
Impairment and recovery of updating behaviour when direct cortical links are disrupted. Top panels show the double-step conditions used to test updating behaviour in split-brain monkeys. In the across-hemifield condition (a), the second target (T2) appears in the right visual field when the eyes are at central fixation and, therefore, is initially represented by neurons in the left hemisphere (black T2). When the eyes reach the first target T1, the memory trace of T2 is now located in the left visual field and encoded by neurons in the right hemisphere (grey T2′). Updating in this condition must involve a transfer of visual information between cortical hemispheres. In the within-hemifield condition (b), T2 is in the right visual field both at FP and at T1; updating, therefore, involves communication within the same hemisphere. Behavioural testing revealed an initial impairment on across-hemifield sequences (c). The inset shows the six randomly interleaved sequences that were tested: trained central sequences (black) and novel within (green) and across (red) sequences. Eye traces show double-step performance in the first 10 trials of the first testing session for monkeys EM (top) and CH (bottom). Dots indicate the locations of FP, T1 and T2; scale bar represents 10°. Summary data from the first session (d) show the second-saccade endpoints, which indicate a persistent impairment for monkey EM in both visual fields. There is rapid improvement for monkey CH in the left but not the right hemifield. Summary data from the final session of testing (e) show that both monkeys ultimately achieved successful performance on across-hemifield sequences. Adapted from Berman et al. [61].
Figure 6.
Figure 6.
Within–across (WA) index distributions in superficial and intermediate SC for split-brain and intact monkeys. Indices are calculated as: [(neural activity for within trials)−(neural activity for across trials)]/(sum of activity on within and across trials). Values are normalized to a saccade control condition before calculation. Values were calculated for all neurons with significant remapping in both within and across conditions. Positive WA indicates stronger remapping during within conditions. WA index distribution for superficial layers is not significantly biased towards within or across conditions in either split-brain (a) or intact monkeys (b). Split-brain monkeys have significantly more cells with positive WA indices in the intermediate layers (c). The intact monkey shows no significant shift in WA index values (d). From Dunn et al. [33].

References

    1. Melcher D., Colby C. L. 2008. Trans-saccadic perception. Trends Cogn. Sci. 12, 466–47310.1016/j.tics.2008.09.003 (doi:10.1016/j.tics.2008.09.003) - DOI - DOI - PubMed
    1. Duhamel J. R., Colby C. L., Goldberg M. E. 1992. The updating of the representation of visual space in parietal cortex by intended eye movements. Science 255, 90–9210.1126/science.1553535 (doi:10.1126/science.1553535) - DOI - DOI - PubMed
    1. Nakamura K., Colby C. L. 2002. Updating of the visual representation in monkey striate and extrastriate cortex during saccades. Proc. Natl Acad. Sci. USA 99, 4026–403110.1073/pnas.052379899 (doi:10.1073/pnas.052379899) - DOI - DOI - PMC - PubMed
    1. Sommer M. A., Wurtz R. H. 2006. Influence of the thalamus on spatial visual processing in frontal cortex. Nature 444, 374–37710.1038/nature05279 (doi:10.1038/nature05279) - DOI - DOI - PubMed
    1. Kusunoki M., Goldberg M. E. 2003. The time course of perisaccadic receptive field shifts in the lateral intraparietal area of the monkey. J. Neurophysiol. 89, 1519–152710.1152/jn.00519.2002 (doi:10.1152/jn.00519.2002) - DOI - DOI - PubMed

LinkOut - more resources