

The microcirculation: physiology at the mesoscale
- PMID: 21242255
- PMCID: PMC3060585
- DOI: 10.1113/jphysiol.2010.201541
The microcirculation: physiology at the mesoscale
Abstract
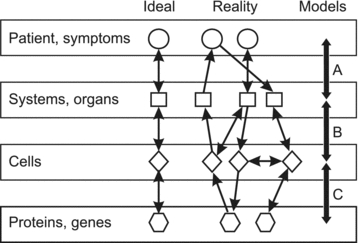
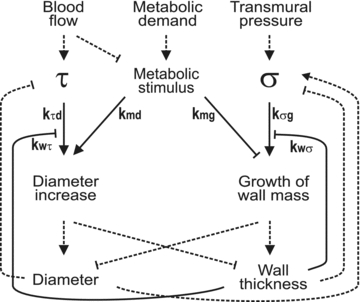
The microcirculation exemplifies the mesoscale in physiological systems, bridging larger and smaller scale phenomena. Microcirculatory research represents an example of a 'middle-out,' rather than 'top-down' or 'bottom-up,' approach to the study of biological function. Computational and mathematical approaches can be used to analyse the functioning of the microcirculation and to establish quantitative relationships between microvascular processes and phenomena occurring on larger and smaller scales, leading to insights which could not be obtained solely by reductionist biological experiments. Given its integrative approach to processes occurring on disparate scales and its emphasis on theoretical as well as experimental approaches, microcirculatory research belongs within current definitions of systems biology.
Figures


Similar articles
-
Microcirculatory network structures and models.Ann Biomed Eng. 2000 Aug;28(8):916-21. doi: 10.1114/1.1308495. Ann Biomed Eng. 2000. PMID: 11144675
-
Microcirculation and the physiome projects.Microcirculation. 2008 Nov;15(8):835-9. doi: 10.1080/10739680802388906. Microcirculation. 2008. PMID: 19051119 Free PMC article. Review.
-
Theoretical modeling in hemodynamics of microcirculation.Microcirculation. 2008 Nov;15(8):699-714. doi: 10.1080/10739680802229589. Microcirculation. 2008. PMID: 18720227 Review.
-
The Benjamin W. Zweifach Award Lecture. Blood cell deformability and interactions: from molecules to micromechanics and microcirculation.Microvasc Res. 1992 Nov;44(3):243-54. doi: 10.1016/0026-2862(92)90084-3. Microvasc Res. 1992. PMID: 1479926
-
Toward computational systems biology.Cell Biochem Biophys. 2004;40(2):167-84. doi: 10.1385/CBB:40:2:167. Cell Biochem Biophys. 2004. PMID: 15054221 Review.
Cited by
-
Microvascular Damage in a Young Female Archer Assessed by Nailfold Videocapillaroscopy: A Case Report.Int J Environ Res Public Health. 2020 Jun 12;17(12):4218. doi: 10.3390/ijerph17124218. Int J Environ Res Public Health. 2020. PMID: 32545690 Free PMC article.
-
Giant sucking sound: can physiology fill the intellectual void left by the reductionists?J Appl Physiol (1985). 2011 Aug;111(2):335-42. doi: 10.1152/japplphysiol.00565.2011. Epub 2011 Jun 2. J Appl Physiol (1985). 2011. PMID: 21636568 Free PMC article. Review.
-
Exploring the effects of Xinnaoning capsule in microcirculatory dysfunction model rats through laser speckle contrast imaging and metabolomics.Front Pharmacol. 2025 Aug 11;16:1647514. doi: 10.3389/fphar.2025.1647514. eCollection 2025. Front Pharmacol. 2025. PMID: 40860876 Free PMC article.
-
Computational modelling suggests complex interactions between interstitial flow and tumour angiogenesis.J R Soc Interface. 2018 Sep;15(146):20180415. doi: 10.1098/rsif.2018.0415. J R Soc Interface. 2018. PMID: 30185542 Free PMC article.
-
A method for longitudinal, transcranial imaging of blood flow and remodeling of the cerebral vasculature in postnatal mice.Physiol Rep. 2014 Dec 18;2(12):e12238. doi: 10.14814/phy2.12238. Print 2014 Dec 1. Physiol Rep. 2014. PMID: 25524276 Free PMC article.
References
-
- Aderem A. Systems biology: Its practice and challenges. Cell. 2005;121:511–513. - PubMed
-
- Duling BR, Damon DH. An examination of the measurement of flow heterogeneity in striated muscle. Circ Res. 1987;60:1–13. - PubMed
-
- Goodman AH, Einstein R, Granger HJ. Effect of changing metabolic rate on local blood flow control in the canine hindlimb. Circ Res. 1978;43:769–776. - PubMed
-
- Johnson PC. Autoregulation of blood flow. Circ Res. 1986;59:483–495. - PubMed
Publication types
MeSH terms
Grants and funding
LinkOut - more resources
Full Text Sources