. 2011 Feb 1;124(Pt 3):348-58.
doi: 10.1242/jcs.072272.

A reduction in ATP demand and mitochondrial activity with neural differentiation of human embryonic stem cells

Affiliations

A reduction in ATP demand and mitochondrial activity with neural differentiation of human embryonic stem cells

Matthew J Birket et al. J Cell Sci. .

Abstract

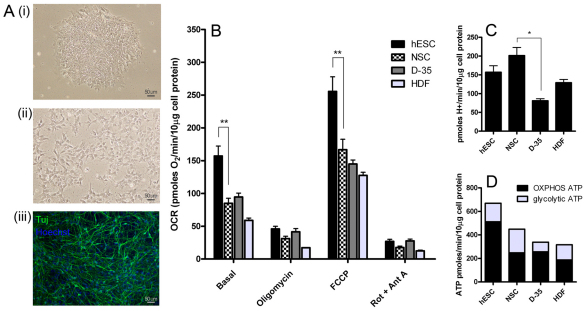
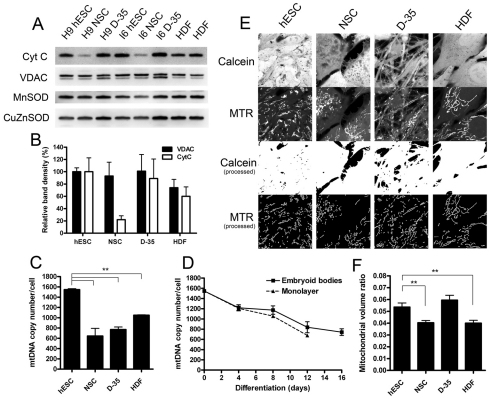
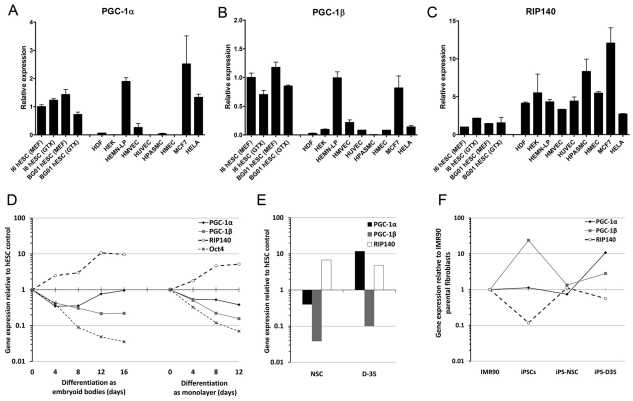
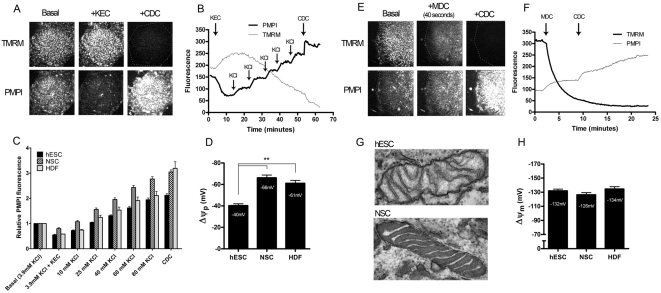
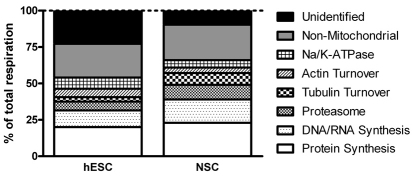
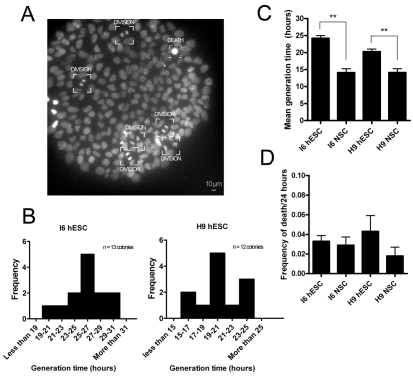
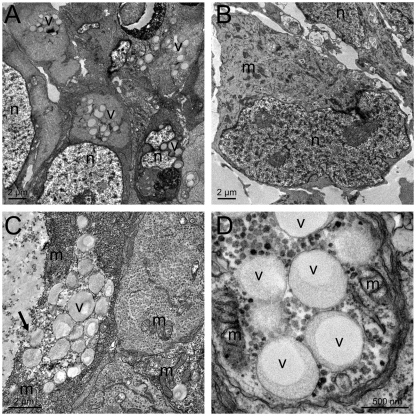
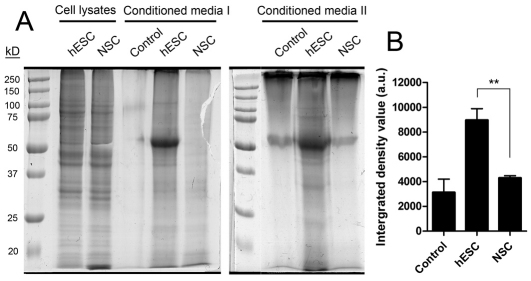
Here, we have investigated mitochondrial biology and energy metabolism in human embryonic stem cells (hESCs) and hESC-derived neural stem cells (NSCs). Although stem cells collectively in vivo might be expected to rely primarily on anaerobic glycolysis for ATP supply, to minimise production of reactive oxygen species, we show that in vitro this is not so: hESCs generate an estimated 77% of their ATP through oxidative phosphorylation. Upon differentiation of hESCs into NSCs, oxidative phosphorylation declines both in absolute rate and in importance relative to glycolysis. A bias towards ATP supply from oxidative phosphorylation in hESCs is consistent with the expression levels of the mitochondrial gene regulators peroxisome-proliferator-activated receptor γ coactivator (PGC)-1α, PGC-1β and receptor-interacting protein 140 (RIP140) in hESCs when compared with a panel of differentiated cell types. Analysis of the ATP demand showed that the slower ATP turnover in NSCs was associated with a slower rate of most energy-demanding processes but occurred without a reduction in the cellular growth rate. This mismatch is probably explained by a higher rate of macromolecule secretion in hESCs, on the basis of evidence from electron microscopy and an analysis of conditioned media. Taken together, our developmental model provides an understanding of the metabolic transition from hESCs to more quiescent somatic cell types, and supports important roles for mitochondria and secretion in hESC biology.


Figures

Fig. 1.
Fig. 1.
hESCs show high levels of mitochondrial activity and a bias for aerobic ATP production. (A) The differentiation scheme used for measurements. Pluripotent I6 hESCs (i), multipotent I6 neural stem cells (NSCs) (ii) and differentiated I6 NSCs (D-35) (iii), stained for neuronal Tuj-β-tubulin. BJ fibroblasts (HDF) were also analysed (image not shown). (B) Oxygen consumption rate (OCR) measured on adherent cultures normalised to cell protein levels. Basal, endogenous rate; Oligomycin, ATP-synthase-inhibited rate; FCCP, maximal uncoupled rate; and Rot + Ant A, rotenone- and antimycin-A-inhibited rate. (C) Proton production rate from measurements taken in tandem with respiration rates. (D) ATP production rate from oxidative phosphorylation and glycolysis. Results shown are the means+s.e.m. from independent experiments (hESC, n=10; NSC, n=11; D-35, n=3; and HDF, n=4). The statistical significance was calculated from a one-way ANOVA using Dunnett's correction. *P<0.05, **P<0.01.
Fig. 2.
Fig. 2.
Mitochondrial content is altered with hESC differentiation. (A) Western blots for mitochondrial [cytochrome c (Cyt C) and VDAC] and antioxidant proteins (MnSOD and CuZnSOD) in whole-cell lysates from hESC cultures with corresponding NSCs and differentiated NSCs (D-35), compared with BJ fibroblasts (HDF). (B) Protein band quantification for cytochrome c and VDAC from three independent lysates for each sample normalised to the hESC protein level. Results represent the means+s.d. of combined data from the I6 and H9 lines. (C) mtDNA copy number per cell in hESCs and differentiated cells. Results shown are the means+s.e.m. for the H9 and I6 stem cell lines and the HDFs. (D) mtDNA copy number changes during hESC differentiation as embryoid bodies or as a monolayer. Results shown are the means+s.e.m. for independent experiments in the H9 and I6 stem cell lines. (E) Confocal images for mitochondrial volume ratio determination. Calcein-AM labels the cytoplasm and MitoTracker Red (MTR) labels the mitochondria. The upper two panels show the raw images for each channel and the lower two panels show the binary processed images, which were used as input for the calculation. (F) Mitochondrial volume ratio quantification from confocal imaging. Data represent means±s.e.m. for at least four independent experiments with both H9 and I6 stem cell lines. The statistical significance was calculated from a one-way ANOVA using Dunnett's correction. **P<0.01.
Fig. 3.
Fig. 3.
Gene expression profiles for three metabolic master regulators highlight similarities between pluripotent stem cells and other energy demanding cell types. Real-time reverse transcription–PCR data for expression of the mRNA encoding PGC-1α (A), PGC-1β (B) and RIP140 (C) in I6 and BG01 hESC lines maintained on feeder cells (MEF) or on Geltrex in conditioned medium (GTX) compared with seven other primary cell types and two cancer cell lines. HDF, human diploid fibroblast; HEK, human epidermal keratinocyte; HEMN-LP, human epidermal melanocyte-low pigmented; HMVEC, human mammary vein endothelial cells; HUVEC, human umbilical vein endothelial cells; HPASMC, human pulmonary artery smooth muscle cells; HMEC, human mammary epithelial cells, MCF7, breast cancer cell line; and HeLa, cervical cancer cell line. Results represent means+s.e.m. for 2–4 independent RNA preparations. (D) Real-time reverse transcription–PCR data during differentiation of hESCs as embryoid bodies or as a monolayer. Data represent the mean values for two hESC lines (H9 and I6). (E) mRNA expression for NSCs and D-35 cells relative to their parental hESC lines. (F) mRNA expression changes during reprogramming of IMR31 fibroblasts into iPSCs and differentiation into iPSC-NSCs and iPSC-D35 cells.
Fig. 4.
Fig. 4.
Resting plasma and mitochondrial membrane potential determination in hESCs and differentiated cells. (A) Time-lapse images of a hESC colony labelled with TMRM and PMPI potentiometric probes, under basal conditions, following addition of the K+ equilibrium cocktail (KEC) and the complete depolarisation cocktail (CDC). (B) Fluorescence intensity traces corresponding to A. Following the KEC addition, sequential replacement steps with KCl-based medium were performed as indicated. Finally the plasma membrane was completely depolarised with the addition of the CDC. (C) Mean normalised PMPI fluorescence values obtained for the three indicated cell types at the indicated extracellular K+ concentrations. (D) Mean (+s.e.m.) resting plasma membrane potentials for hESCs, NSCs and HDFs (hESC and NSC, n=8; HDF, n=3). Potentials were derived from C as given in the supplementary methods. (E) Time-lapse images of a hESC colony labelled with TMRM and PMPI, under basal conditions, 40 seconds after addition of the mitochondrial depolarisation cocktail (MDC) and after addition of the CDC. (F) Fluorescence intensity traces corresponding to E. Mitochondrial depolarisation was triggered with the MDC as indicated and finally complete depolarisation was achieved with the CDC. Parameters derived from the fluorescence traces are shown in supplementary material Fig. S3. (G) Electron micrographs of typical mitochondria in hESCs and NSCs (viewed at 105,000×). (H) Mean (+s.e.m.) resting mitochondrial membrane potential values for hESCs, NSCs and HDFs (hESC, n=28; NSC, n=16; and HDF, n=13). Potentials were derived from experiments similar to those shown in F and as given in the supplementary methods. The statistical significance was calculated from a one-way ANOVA using Dunnett's correction. **P<0.01.
Fig. 5.
Fig. 5.
The relative division of energy-consuming reactions is largely maintained between hESCs and NSCs. The relative division of total respiration is shown, corresponding to the values in Table 1.
Fig. 6.
Fig. 6.
Cell generation times for hESCs and NSCs. (A) hESC colony labelled with Hoechst 33342 under time-lapse imaging. Cells undergoing mitosis or cell death are labelled. (B) hESC mean cell generation times deduced from individual colonies from the I6 and H9 hESC lines. (C) Estimated mean (+s.e.m.) cell generation times for I6 and H9 hESCs (n=12 each) and NSCs (n=4 each). (D) Mean (+s.e.m.) frequency of cell death over a 24-hour period. Significance between values was calculated using a Student's t-test. **P<0.01.
Fig. 7.
Fig. 7.
Secretory-like vesicles are uniquely present in hESCs. (A) Transmission electron micrographs of a typical field inside an I6 hESC colony with clusters of secretory vesicles in most cells. (B) Typical I6 NSC; no structures resembling the vesicle clusters of hESCs are seen in NSCs. (C,D) Magnifications of hESC secretory-vesicle-rich areas of H9 hESC and I6 hESCs lines, respectively. The arrow marks the goblet-cell-like secretion mechanism. Panel D shows that secretory vesicles are often surrounded by mitochondria and granules resembling polysomes. v, secretory vesicles appearing as membrane-bound structures with homogeneous content; m, mitochondrion; n, nucleus.
Fig. 8.
Fig. 8.
hESCs secrete more protein than NSCs. (A) Proteins precipitated from the medium conditioned by I6 hESCs or NSCs for 10 hours were subjected to SDS-PAGE and stained with GelCode Coomassie Blue stain. Loading of precipitated material was corrected for the amount of cell protein in each experiment. Whole-cell lysate lanes are shown for 85 μg of protein. The control lane is from a medium- or Geltrex-only precipitation. The gels are representative of two independent experiments. (B) Quantification of total precipitated protein using densitometry. The intense band at 55 kDa, also visible in the control, was excluded from the quantification. Values are means+s.d. for three independent experiments. Significance between values was calculated using a Student's t-test. **P<0.01.

References

    1. Arany Z., Lebrasseur N., Morris C., Smith E., Yang W., Ma Y., Chin S., Spiegelman B. M. (2007). The transcriptional coactivator PGC-1beta drives the formation of oxidative type IIX fibers in skeletal muscle. Cell Metab. 5, 35-46 - PubMed
    1. Armstrong L., Hughes O., Yung S., Hyslop L., Stewart R., Wappler I., Peters H., Walter T., Stojkovic P., Evans J., et al. (2006). The role of PI3K/AKT, MAPK/ERK and NFkappabeta signalling in the maintenance of human embryonic stem cell pluripotency and viability highlighted by transcriptional profiling and functional analysis. Hum. Mol. Genet. 15, 1894-1913 - PubMed
    1. Armstrong L., Tilgner K., Saretzki G., Atkinson S. P., Stojkovic M., Moreno R., Przyborski S., Lako M. (2010). Human induced pluripotent stem cell lines show similar stress defence mechanisms and mitochondrial regulation to human embryonic stem cells. Stem Cells 28, 661-673 - PubMed
    1. Becker K. A., Ghule P. N., Therrien J. A., Lian J. B., Stein J. L., van Wijnen A. J., Stein G. S. (2006). Self-renewal of human embryonic stem cells is supported by a shortened G1 cell cycle phase. J. Cell. Physiol. 209, 883-893 - PubMed
    1. Becker K. A., Stein J. L., Lian J. B., van Wijnen A. J., Stein G. S. (2010). Human embryonic stem cells are pre-mitotically committed to self-renewal and acquire a lengthened G1 phase upon lineage programming. J. Cell. Physiol. 222, 103-110 - PMC - PubMed

Publication types

MeSH terms

Substances