TLR3-specific double-stranded RNA oligonucleotide adjuvants induce dendritic cell cross-presentation, CTL responses, and antiviral protection
- PMID: 21242525
- PMCID: PMC3078629
- DOI: 10.4049/jimmunol.1002845
TLR3-specific double-stranded RNA oligonucleotide adjuvants induce dendritic cell cross-presentation, CTL responses, and antiviral protection
Abstract
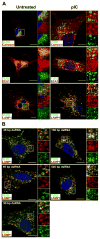
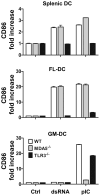
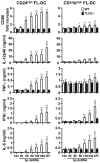
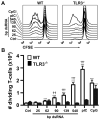
Maturation of dendritic cells (DC) to competent APC is essential for the generation of acquired immunity and is a major function of adjuvants. dsRNA, a molecular signature of viral infection, drives DC maturation by activating TLR3, but the size of dsRNA required to activate DC and the expression patterns of TLR3 protein in DC subsets have not been established. In this article, we show that cross-priming CD8α(+) and CD103(+) DC subsets express much greater levels of TLR3 than other DC. In resting DC, TLR3 is located in early endosomes and other intracellular compartments but migrates to LAMP1(+) endosomes on stimulation with a TLR3 ligand. Using homogeneous dsRNA oligonucleotides (ONs) ranging in length from 25 to 540 bp, we observed that a minimum length of ∼90 bp was sufficient to induce CD86, IL-12p40, IFN-β, TNF-α, and IL-6 expression, and to mature DC into APC that cross-presented exogenous Ags to CD8(+) T cells. TLR3 was essential for activation of DC by dsRNA ONs, and the potency of activation increased with dsRNA length and varied between DC subsets. In vivo, dsRNA ONs, in a size-dependent manner, served as adjuvants for the generation of Ag-specific CTL and for inducing protection against lethal challenge with influenza virus when given with influenza nucleoprotein as an immunogen. These results provide the basis for the development of TLR3-specific adjuvants capable of inducing immune responses tailored for viral pathogens.
Conflict of interest statement
Disclosures: The authors have declared that no conflict of interest exists.
Figures


Similar articles
-
TLR3-Mediated CD8+ Dendritic Cell Activation Is Coupled with Establishment of a Cell-Intrinsic Antiviral State.J Immunol. 2015 Aug 1;195(3):1025-33. doi: 10.4049/jimmunol.1402033. Epub 2015 Jun 22. J Immunol. 2015. PMID: 26101320
-
Contribution of direct and cross-presentation to CTL immunity against herpes simplex virus 1.J Immunol. 2009 Jan 1;182(1):283-92. doi: 10.4049/jimmunol.182.1.283. J Immunol. 2009. PMID: 19109159
-
Broadly Protective CD8+ T Cell Immunity to Highly Conserved Epitopes Elicited by Heat Shock Protein gp96-Adjuvanted Influenza Monovalent Split Vaccine.J Virol. 2021 May 24;95(12):e00507-21. doi: 10.1128/JVI.00507-21. Print 2021 May 24. J Virol. 2021. PMID: 33827939 Free PMC article.
-
Particulate formulations for the delivery of poly(I:C) as vaccine adjuvant.Adv Drug Deliv Rev. 2013 Oct;65(10):1386-99. doi: 10.1016/j.addr.2013.05.013. Epub 2013 Jun 7. Adv Drug Deliv Rev. 2013. PMID: 23751781 Review.
-
Role of Toll-like receptors in costimulating cytotoxic T cell responses.Eur J Immunol. 2003 Jun;33(6):1465-70. doi: 10.1002/eji.200323919. Eur J Immunol. 2003. PMID: 12778463 Review.
Cited by
-
Immune players in the CNS: the astrocyte.J Neuroimmune Pharmacol. 2013 Sep;8(4):824-39. doi: 10.1007/s11481-013-9480-6. Epub 2013 Jul 4. J Neuroimmune Pharmacol. 2013. PMID: 23821340 Review.
-
Development of a universal CTL-based vaccine for influenza.Bioengineered. 2013 Nov-Dec;4(6):374-8. doi: 10.4161/bioe.23573. Epub 2013 Jan 21. Bioengineered. 2013. PMID: 23337287 Free PMC article. Review.
-
TAMable tumor-associated macrophages in response to innate RNA sensing.Oncoimmunology. 2012 Sep 1;1(6):1000-1001. doi: 10.4161/onci.19894. Oncoimmunology. 2012. PMID: 23162785 Free PMC article.
-
Sources of Type I Interferons in Infectious Immunity: Plasmacytoid Dendritic Cells Not Always in the Driver's Seat.Front Immunol. 2019 Apr 12;10:778. doi: 10.3389/fimmu.2019.00778. eCollection 2019. Front Immunol. 2019. PMID: 31031767 Free PMC article. Review.
-
Toll-Like Receptor 3 Signal in Dendritic Cells Benefits Cancer Immunotherapy.Front Immunol. 2017 Dec 21;8:1897. doi: 10.3389/fimmu.2017.01897. eCollection 2017. Front Immunol. 2017. PMID: 29312355 Free PMC article. Review.
References
-
- Banchereau J, Steinman RM. Dendritic cells and the control of immunity. Nature. 1998;392:245–252. - PubMed
-
- Steinman RM. Dendritic cells: understanding immunogenicity. Eur J Immunol. 2007;37(Suppl 1):S53–S60. - PubMed
-
- Batista FD, Harwood NE. The who, how and where of antigen presentation to B cells. Nat Rev Immunol. 2009;9:15–27. - PubMed
-
- Guermonprez P, Valladeau J, Zitvogel L, Thery C, Amigorena S. Antigen presentation and T cell stimulation by dendritic cells. Annu Rev Immunol. 2002;20:621–667. - PubMed
-
- Kapsenberg ML. Dendritic-cell control of pathogen-driven T-cell polarization. Nat Rev Immunol. 2003;3:984–993. - PubMed
Publication types
MeSH terms
Substances
Grants and funding
LinkOut - more resources
Full Text Sources
Other Literature Sources
Medical
Molecular Biology Databases
Research Materials
Miscellaneous

