

A Bayesian framework for inference of the genotype-phenotype map for segregating populations
- PMID: 21242536
- PMCID: PMC3070524
- DOI: 10.1534/genetics.110.123273
A Bayesian framework for inference of the genotype-phenotype map for segregating populations
Abstract
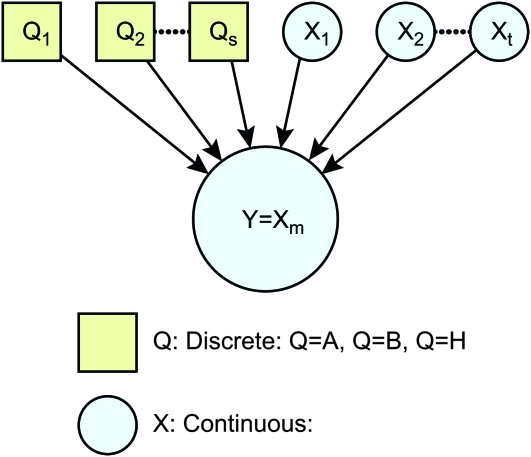
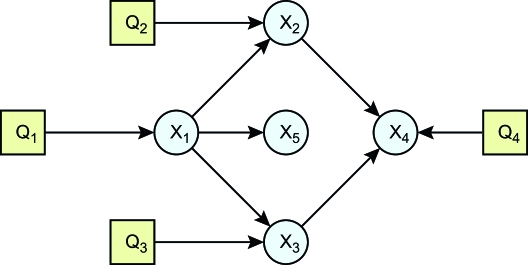
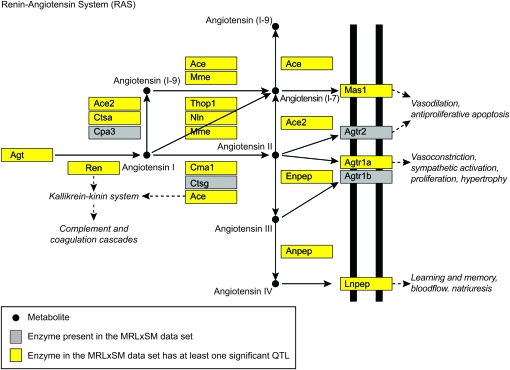
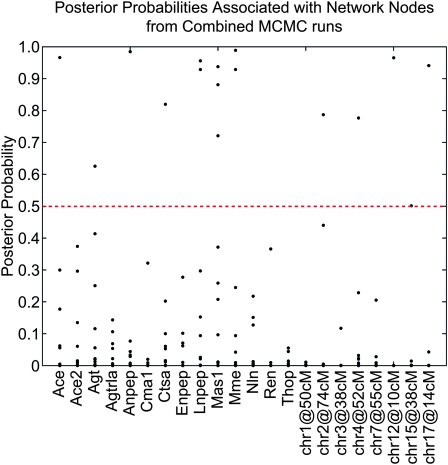
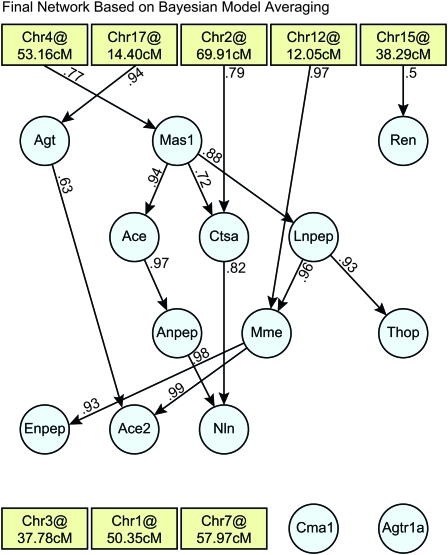
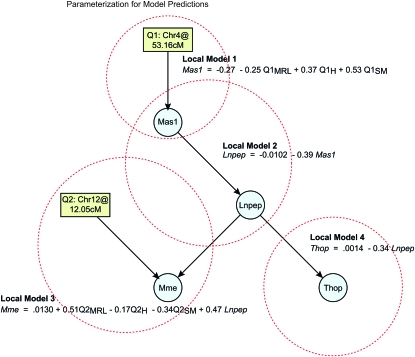
Complex genetic interactions lie at the foundation of many diseases. Understanding the nature of these interactions is critical to developing rational intervention strategies. In mammalian systems hypothesis testing in vivo is expensive, time consuming, and often restricted to a few physiological endpoints. Thus, computational methods that generate causal hypotheses can help to prioritize targets for experimental intervention. We propose a Bayesian statistical method to infer networks of causal relationships among genotypes and phenotypes using expression quantitative trait loci (eQTL) data from genetically randomized populations. Causal relationships between network variables are described with hierarchical regression models. Prior distributions on the network structure enforce graph sparsity and have the potential to encode prior biological knowledge about the network. An efficient Monte Carlo method is used to search across the model space and sample highly probable networks. The result is an ensemble of networks that provide a measure of confidence in the estimated network topology. These networks can be used to make predictions of system-wide response to perturbations. We applied our method to kidney gene expression data from an MRL/MpJ × SM/J intercross population and predicted a previously uncharacterized feedback loop in the local renin-angiotensin system.
Figures
Similar articles
-
Belief propagation in genotype-phenotype networks.Stat Appl Genet Mol Biol. 2016 Mar;15(1):39-53. doi: 10.1515/sagmb-2015-0058. Stat Appl Genet Mol Biol. 2016. PMID: 26910752
-
Using stochastic causal trees to augment Bayesian networks for modeling eQTL datasets.BMC Bioinformatics. 2011 Jan 6;12:7. doi: 10.1186/1471-2105-12-7. BMC Bioinformatics. 2011. PMID: 21211042 Free PMC article.
-
Causal inference in biology networks with integrated belief propagation.Pac Symp Biocomput. 2015:359-70. Pac Symp Biocomput. 2015. PMID: 25592596 Free PMC article.
-
Causal Queries from Observational Data in Biological Systems via Bayesian Networks: An Empirical Study in Small Networks.Methods Mol Biol. 2019;1883:111-142. doi: 10.1007/978-1-4939-8882-2_5. Methods Mol Biol. 2019. PMID: 30547398 Review.
-
Bayesian Computation Methods for Inferring Regulatory Network Models Using Biomedical Data.Adv Exp Med Biol. 2016;939:289-307. doi: 10.1007/978-981-10-1503-8_12. Adv Exp Med Biol. 2016. PMID: 27807752 Review.
Cited by
-
Linking traits based on their shared molecular mechanisms.Elife. 2015 Mar 17;4:e04346. doi: 10.7554/eLife.04346. Elife. 2015. PMID: 25781485 Free PMC article.
-
Mathematical and statistical modeling in cancer systems biology.Front Physiol. 2012 Jun 28;3:227. doi: 10.3389/fphys.2012.00227. eCollection 2012. Front Physiol. 2012. PMID: 22754537 Free PMC article.
-
Statistical Methods in Integrative Genomics.Annu Rev Stat Appl. 2016 Jun;3:181-209. doi: 10.1146/annurev-statistics-041715-033506. Epub 2016 Apr 18. Annu Rev Stat Appl. 2016. PMID: 27482531 Free PMC article.
-
Modeling causality for pairs of phenotypes in system genetics.Genetics. 2013 Mar;193(3):1003-13. doi: 10.1534/genetics.112.147124. Epub 2013 Jan 3. Genetics. 2013. PMID: 23288936 Free PMC article.
-
A Microbe Associated with Sleep Revealed by a Novel Systems Genetic Analysis of the Microbiome in Collaborative Cross Mice.Genetics. 2020 Mar;214(3):719-733. doi: 10.1534/genetics.119.303013. Epub 2020 Jan 2. Genetics. 2020. PMID: 31896565 Free PMC article.
References
-
- Broman, K. W., and S. Sen, 2009. A Guide to QTL Mapping With R/qtl. Springer-Verlag, Berlin/Heidelberg, Germany/New York.
-
- Calvetti, D., J. P. Kaipio and E. Somersalo, 2006. Aristotelian prior boundary conditions. Int. J. Math. Comput. Sci. 1 63–81.
Publication types
MeSH terms
Associated data
- Actions
Grants and funding
LinkOut - more resources
Full Text Sources
Molecular Biology Databases
