

Gene expression changes are associated with loss of kidney graft function and interstitial fibrosis and tubular atrophy: diagnosis versus prediction
- PMID: 21242883
- PMCID: PMC7936857
- DOI: 10.1097/TP.0b013e3182094a5a
Gene expression changes are associated with loss of kidney graft function and interstitial fibrosis and tubular atrophy: diagnosis versus prediction
Abstract
Background: Loss of kidney graft function due to interstitial fibrosis (IF) and tubular atrophy (TA) is the most common cause of kidney allograft loss.
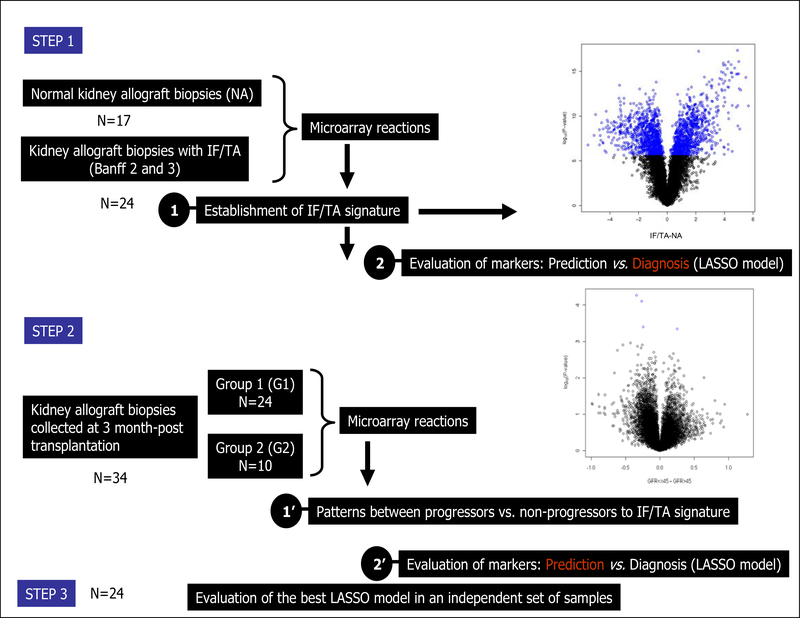
Methods: One hundred one allograft tissues (26 samples with IF/TA, 17 normal allografts, and an independent biopsy group collected at 3 month [n=34] posttransplantation) underwent microarray analysis to identify early detection/diagnostic biomarkers of IF/TA. Profiling of 24 allograft biopsies collected at or after 9-month posttransplantation (range 9-18 months) was used for validation. Three-month posttransplantation biopsies were classified as IF/TA nonprogressors (group 1) or progressors (group 2) using graft function and histology at 9-month posttransplantation.
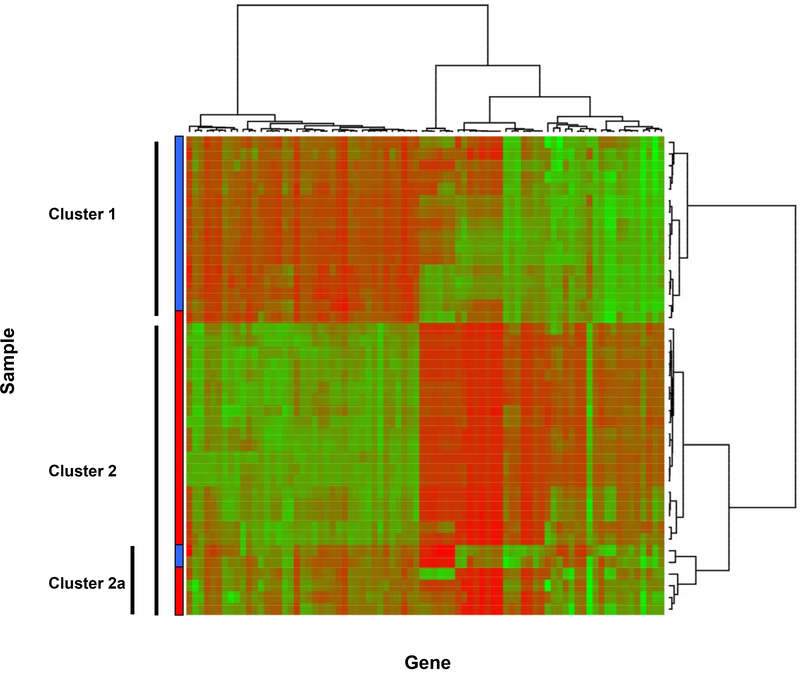
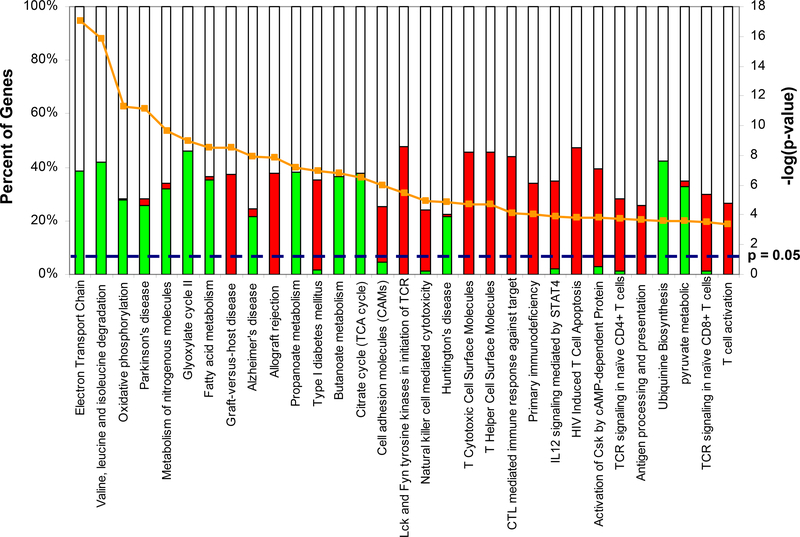
Results: We identified 2223 differentially expressed probe sets between IF/TA and normal allograft biopsies using a Bonferroni correction. Genes up-regulated in IF/TA were primarily involved in pathways related to T-cell activation, natural killer cell-mediated cytotoxicity, and programmed cell death. A least absolute shrinkage and selection operator model was derived from the differentially expressed probe sets, resulting in a final model that included 10 probe sets and had 100% training set accuracy. The N-fold crossvalidated error was 2.4% (sensitivity 95.8% and specificity 100%). When 3-month biopsies were tested using the model, all the samples were classified as normal. However, evaluating gene expression of the 3-month biopsies and fitting a new penalized model, 100% sensitivity was observed in classifying the samples as group1 or 2. This model was evaluated in the sample set collected at or after 9-month posttransplantation.
Conclusions: An IF/TA gene expression signature was identified, and it was useful for diagnosis but not prediction. However, gene expression profiles at 3 months might predict IF/TA progression.
Figures
References
-
- Nankivell BJ, Chapman JR. Chronic allograft nephropathy: Current concepts and future directions. Transplantation 2006; 81: 643. - PubMed
-
- Li C, Yang CW. The pathogenesis and treatment of chronic allograft nephropathy. Nat Rev Nephrol 2009; 5: 513. - PubMed
-
- Matas AJ, Leduc R, Rush D, et al. Histopathologic clusters differentiate subgroups within the nonspecific diagnoses of CAN or CR: Preliminary data from the DeKAF study. Am J Transplant 2010; 10: 315. - PubMed
-
- Mannon RB. Therapeutic targets in the treatment of allograft fibrosis. Am J Transplant 2006; 6(5 pt 1): 867. - PubMed
Publication types
MeSH terms
Grants and funding
LinkOut - more resources
Full Text Sources
Other Literature Sources
Medical
Miscellaneous
