Development of ultrabright semiconducting polymer dots for ratiometric pH sensing
- PMID: 21244093
- PMCID: PMC3039106
- DOI: 10.1021/ac103140x
Development of ultrabright semiconducting polymer dots for ratiometric pH sensing
Abstract
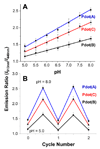
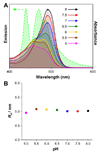
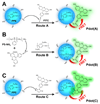
Semiconducting polymer-based nanoparticles (Pdots) have recently emerged as a new class of ultrabright probes for biological detection and imaging. This paper describes the development of poly(2,5-di(3',7'-dimethyloctyl)phenylene-1,4-ethynylene) (PPE) Pdots as a platform for designing Förster resonance energy transfer (FRET)-based ratiometric pH nanoprobes. We describe and compare three routes for coupling the pH-sensitive dye, fluorescein, to PPE Pdots, which is a pH-insensitive semiconducting polymer. This approach offers a rapid and robust sensor for pH determination using the ratiometric methodology where excitation at a single wavelength results in two emission peaks, one that is pH sensitive and the other one that is pH insensitive for use as an internal reference. The linear range for pH sensing of the fluorescein-coupled Pdots is between pH 5.0 and 8.0, which is suitable for most cellular studies. The pH-sensitive Pdots show excellent reversibility and stability in pH measurements. In this paper, we use them to measure the intracellular pH in HeLa cells following their uptake by endocytosis, thus demonstrating their utility for use in cellular and imaging experiments.
Figures


Similar articles
-
Ratiometric pH Sensing and Imaging in Living Cells with Dual-Emission Semiconductor Polymer Dots.Molecules. 2019 Aug 12;24(16):2923. doi: 10.3390/molecules24162923. Molecules. 2019. PMID: 31409040 Free PMC article.
-
Design and fabrication of fluorescence resonance energy transfer-mediated fluorescent polymer nanoparticles for ratiometric sensing of lysosomal pH.J Colloid Interface Sci. 2016 Dec 15;484:298-307. doi: 10.1016/j.jcis.2016.09.009. Epub 2016 Sep 8. J Colloid Interface Sci. 2016. PMID: 27632075
-
Ratiometric detection of copper ions and alkaline phosphatase activity based on semiconducting polymer dots assembled with rhodamine B hydrazide.Biosens Bioelectron. 2017 May 15;91:70-75. doi: 10.1016/j.bios.2016.12.034. Epub 2016 Dec 13. Biosens Bioelectron. 2017. PMID: 28012320
-
Highly fluorescent semiconducting polymer dots for biology and medicine.Angew Chem Int Ed Engl. 2013 Mar 11;52(11):3086-109. doi: 10.1002/anie.201205133. Epub 2013 Jan 10. Angew Chem Int Ed Engl. 2013. PMID: 23307291 Free PMC article. Review.
-
Semiconducting Polymer Dots for Point-of-Care Biosensing and In Vivo Bioimaging: A Concise Review.Biosensors (Basel). 2023 Jan 14;13(1):137. doi: 10.3390/bios13010137. Biosensors (Basel). 2023. PMID: 36671972 Free PMC article. Review.
Cited by
-
Generation of functionalized and robust semiconducting polymer dots with polyelectrolytes.Chem Commun (Camb). 2012 Mar 28;48(26):3161-3. doi: 10.1039/c2cc17703j. Epub 2012 Feb 20. Chem Commun (Camb). 2012. PMID: 22349364 Free PMC article.
-
Reversible Ratiometric NADH Sensing Using Semiconducting Polymer Dots.Angew Chem Int Ed Engl. 2021 May 17;60(21):12007-12012. doi: 10.1002/anie.202100774. Epub 2021 Apr 16. Angew Chem Int Ed Engl. 2021. PMID: 33730372 Free PMC article.
-
A fluorescent sensor constructed from nitrogen-doped carbon nanodots (N-CDs) for pH detection in synovial fluid and urea determination.RSC Adv. 2018 Dec 12;8(72):41432-41438. doi: 10.1039/c8ra08406h. eCollection 2018 Dec 7. RSC Adv. 2018. PMID: 35559313 Free PMC article.
-
Highly luminescent, fluorinated semiconducting polymer dots for cellular imaging and analysis.Chem Commun (Camb). 2013 Sep 25;49(74):8256-8. doi: 10.1039/c3cc44048f. Chem Commun (Camb). 2013. PMID: 23925590 Free PMC article.
-
Copper (II)-doped semiconducting polymer dots for nitroxyl imaging in live cells.RSC Adv. 2016;6(105):103618-103621. doi: 10.1039/C6RA20439B. Epub 2016 Oct 26. RSC Adv. 2016. PMID: 28529727 Free PMC article.
References
Publication types
MeSH terms
Substances
Grants and funding
LinkOut - more resources
Full Text Sources
Other Literature Sources

