. 2011 May;39(9):3505-19.
doi: 10.1093/nar/gkq1271. Epub 2011 Jan 17.

Ikaros interacts with P-TEFb and cooperates with GATA-1 to enhance transcription elongation

Affiliations

Ikaros interacts with P-TEFb and cooperates with GATA-1 to enhance transcription elongation

Stefania Bottardi et al. Nucleic Acids Res. 2011 May.

Abstract

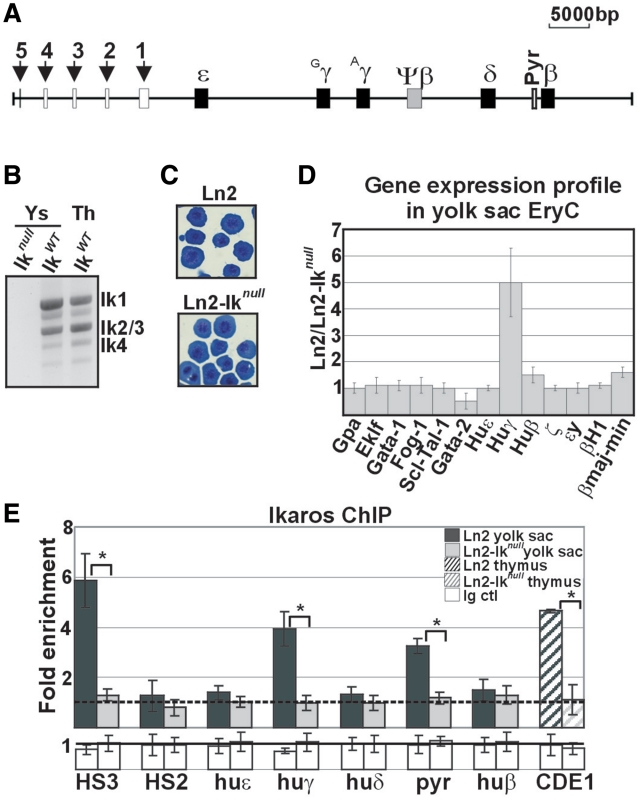
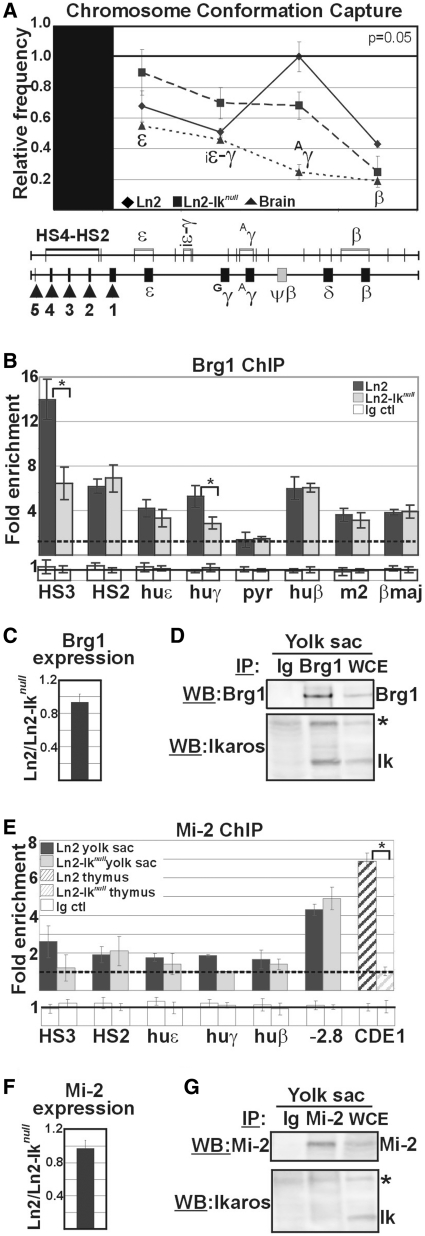
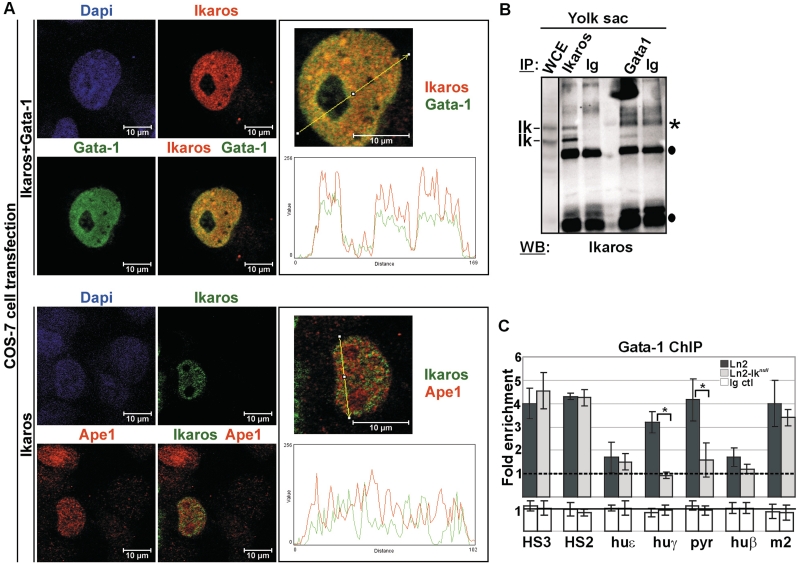
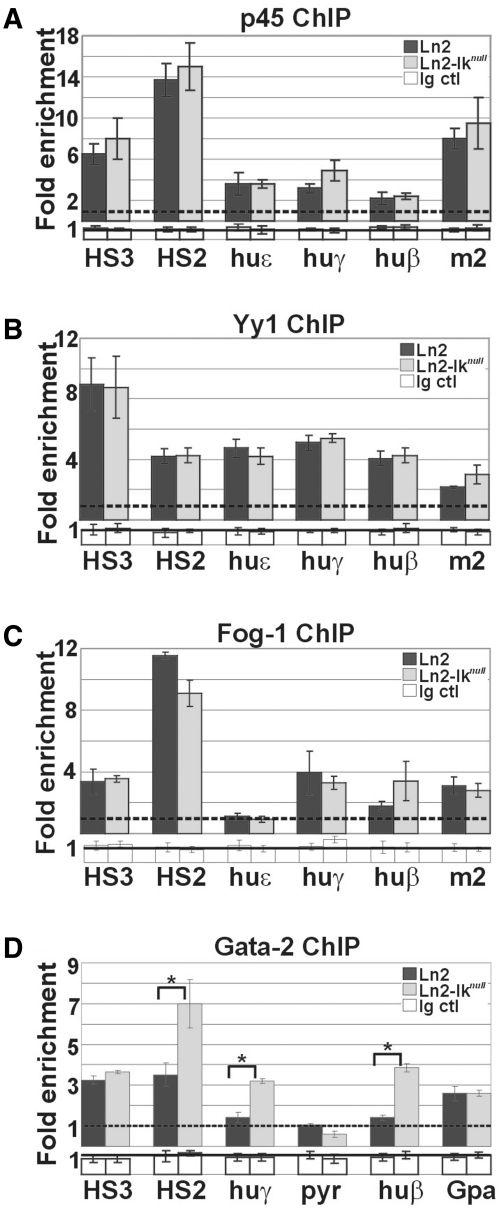
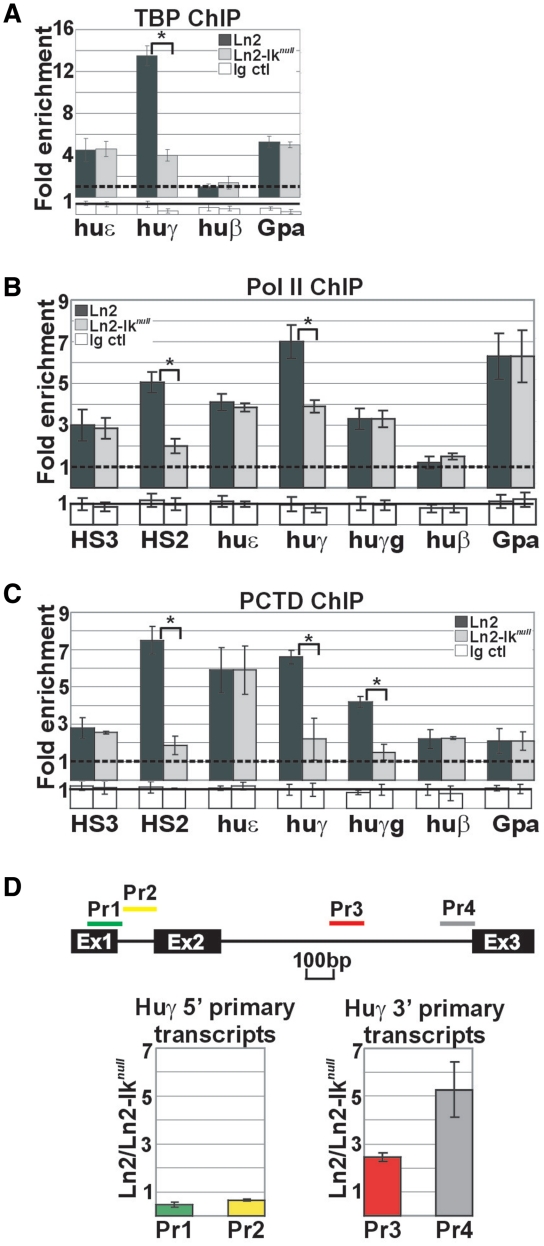
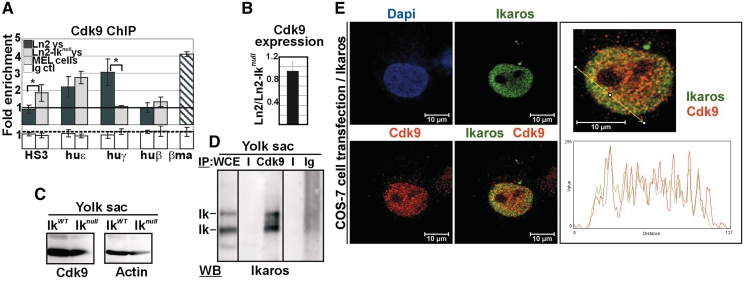
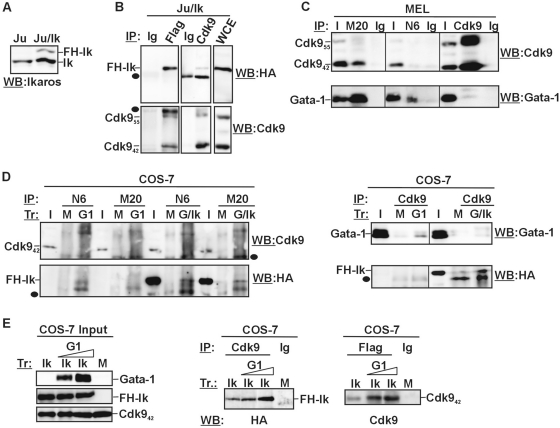
Ikaros is associated with both gene transcriptional activation and repression in lymphocytes. Ikaros acts also as repressor of human γ-globin (huγ-) gene transcription in fetal and adult erythroid cells. Whether and eventually, how Ikaros can function as a transcriptional activator in erythroid cells remains poorly understood. Results presented herein demonstrate that Ikaros is a developmental-specific activator of huγ-gene expression in yolk sac erythroid cells. Molecular analysis in primary cells revealed that Ikaros interacts with Gata-1 and favors Brg1 recruitment to the human β-globin Locus Control Region and the huγ-promoters, supporting long-range chromatin interactions between these regions. Additionally, we demonstrate that Ikaros contributes to transcription initiation and elongation of the huγ-genes, since it is not only required for TBP and RNA Polymerase II (Pol II) assembly at the huγ-promoters but also for conversion of Pol II into the elongation-competent phosphorylated form. In agreement with the latter, we show that Ikaros interacts with Cyclin-dependent kinase 9 (Cdk9), which contributes to efficient transcription elongation by phosphorylating the C-terminal domain of the large subunit of Pol II on Serine 2, and favours Cdk9 recruitment to huγ-promoters. Our results show that Ikaros exerts dual functionality during gene activation, by promoting efficient transcription initiation and elongation.


Figures

Figure 1.
Figure 1.
Morphological and molecular characterization of ln2 and ln2-Iknull yolk sac EryC. (A) Map of the human β-globin locus; black arrows indicate βLCR HSs; genes are indicated by black boxes; (B) RT–PCR performed on ln2-Iknull (Iknull), ln2 (IkWT) yolk sac EryC or ln2 (IkWT) thymus (Th) cells; (C) Wright-Giemsa staining of ln2 or ln2-Iknull yolk sac cells; (D) RT–qPCR of hematopoietic as well as globin gene transcripts performed on equal amounts of ln2 and ln2-Iknull yolk sac EryC; transcript quantification was calculated according to Pfaffl (73) using mouse Actin cDNA as internal control; ln2/ln2-Iknull ratios are plotted as the mean ± SD of the measurements; n ≥ 4; (E) ChIP on ln2 and ln2-Iknull yolk sac EryC or thymus cells carried out with Ikaros antibodies; immunoprecipitated and input chromatin samples were used as template in qPCR; quantification was carried out according to the 2−ΔΔCt method, using mouse kidney-specific Tamm-Horsfall protein (Thp) promoter as internal control; fold enrichments (y-axis) of globin regions relative to the control and the input samples are plotted as the mean ± SD of the measurements; a value of 1 (dashed line) indicates no enrichment; *P ≤ 0.05 by Student’s t-test; huε, huε-promoter; huγ, huγ-promoters; huδ, huδ-promoter; pyr, Pyr region; and huβ, huβ-promoter; dark gray bars: ln2 yolk sac EryC; light gray bars: ln2-Iknull yolk sac EryC; dark gray dashed bars: ln2 thymus cells; light gray dashed bars: ln2-Iknull thymus cells; white bars: isotype-matched Ig (Ig ctl).
Figure 2.
Figure 2.
Brg1 and Mi-2 recruitment to the huβ-globin locus in ln2 and ln2-Iknull yolk sac EryC. (A) Ln2 and ln2-Iknull yolk sac EryC were subjected to 3C assay; nuclei were digested with EcoRI and genomic DNA was ligated and used as template for qPCR; βLCR HS4-HS2 EcoRI fragment was used as ‘fixed’ point and primer sets were designed in order to amplify the genomic regions corresponding to the ε, ε-gene; iε-γ, inter-ε-γ region; Aγ, Aγ-gene and β-gene region; relative crosslinking frequencies (y-axis) of the ‘fixed’ fragment with globin fragments were defined using naked DNA encompassing the whole huβ-globin as control and normalized to endogenous mouse Actin; a value of 1 was attributed to the highest crosslinking frequency; the data are plotted as the mean ± SD of the measurements of five independent experiments; x-axis: position across the locus; rhomboids: ln2 yolk sac EryC; squares: ln2-Iknull yolk sac EryC; triangles: brain cells; (B and E) ChIP on ln2 and ln2-Iknull yolk sac EryC or thymus cells carried out with Brg1 or Mi-2 antibodies; fold enrichments (y-axis) were calculated as described in Figure 1E and are plotted as the mean ± SD of the measurements; a value of 1 (dashed line) indicates no enrichment; *P ≤ 0.05 by Student’s t-test; huε, huε-promoter; huγ, huγ-promoters; pyr, Pyr region; huβ, huβ-promoter; m2, mouse HS2; βmaj, βmajor promoter; −2.8: −2.8 kb region upstream of the Gata-2 promoter and CD4E1: CD4 enhancer 1 region; dark gray bars: ln2 yolk sac EryC; light gray bars: ln2-Iknull yolk sac EryC; dark gray dashed bars: ln2 thymus cells; light gray dashed bars: ln2-Iknull thymus cells; white bars: isotype-matched Ig (Ig ctl); (C and F) RT–qPCR of Brg1 and Mi-2 gene transcripts performed on equal amounts of ln2 and ln2-Iknull yolk sac EryC; transcript quantification was calculated according to Pfaffl (73) using mouse Actin cDNA as internal control; ln2/ln2-Iknull ratios are plotted as the mean ± SD of the measurements; n = 6; (D and G) Protein co-IP of total cell lysates prepared from ln2 yolk sac EryC; cell lysates were immunoprecipitated with Mi-2 or Brg1 antibodies as well as isotype-matched Ig; samples were resolved on SDS–PAGE, immunoblotted and WB membranes were cut in half; the higher half was probed with either Mi-2 or Brg1 antibodies, whereas the lower half was probed with Ikaros antibodies; asterisks indicate non-specific bands; WCE: yolk sac EryC total cell lysate.
Figure 3.
Figure 3.
Ikaros-Gata-1 cooperative binding. (A) Confocal immunofluorescence of COS-7 cells expressing Flag/HA-Ikaros and Gata-1 proteins (Ikaros+Gata-1) or Flag/HA-Ikaros only (Ikaros); Ikaros+Gata-1 transfected cells were stained with mouse antibodies to the HA tag and with rat antibodies to Gata-1; the secondary staining was carried out with TR-conjugated anti-mouse as well as FITC-conjugated anti-rat antibodies; a single COS-7 cell is shown where Ikaros is detected as red signals, Gata-1 as green signals and Ikaros-Gata-1 co-localization as yellow signals in the magnified merged image; Ikaros-transfected cells were stained with rabbit antibodies to the HA tag and with mouse antibodies to Ape1; the secondary staining was carried out with FITC-conjugated anti-rabbit as well as TR-conjugated anti-mouse antibodies; a single COS-7 cell is shown where Ikaros is detected as green signals and Ape1 as red signals; line profile plots were obtained by the WCIF ImageJ(®) program (NIH); (B) Protein co-IP of total cell lysates prepared from ln2 yolk sac EryC; cell lysates were immunoprecipitated with Ikaros or Gata-1 antibodies as well as isotype-matched rabbit (for Ikaros co-IP) or rat (for Gata-1 co-IP) Ig and WB was carried out with Ikaros antibodies; filled circles represent Ig bands; asterisks indicate non-specific bands; WCE: yolk sac EryC total cell lysate; (C) ChIP on ln2 and ln2-Iknull yolk sac EryC carried out with Gata-1 antibodies; fold enrichments (y-axis) were calculated as described in Figure 1E and are plotted as the mean ± SD of the measurements; a value of 1 (dashed line) indicates no enrichment; *P ≤ 0.05 by Student’s t-test; huε, huε-promoter; huγ, huγ-promoters; pyr, Pyr region; huβ, huβ-promoter; m2, mouse HS2; dark gray bars: ln2 yolk sac EryC; light gray bars: ln2-Iknull yolk sac EryC; white bars: isotype-matched Ig (Ig ctl).
Figure 4.
Figure 4.
Recruitment of transcriptional regulators to the huβ-globin locus in yolk sac EryC. (A–D) ChIP on ln2 and ln2-Iknull yolk sac EryC carried out with p45/Nf-e2 (p45), Yy1, Fog-1 and Gata-2 antibodies; fold enrichments (y-axis) were calculated as described in Figure 1E and are plotted as the mean ± SD of the measurements; a value of 1 (dashed line) indicates no enrichment; *P ≤ 0.05 by Student’s t-test; huε, huε-promoter; huγ, huγ-promoters; huβ, huβ-promoter; m2, mouse HS2; Gpa, Glycophorin A promoter; dark gray bars: ln2 yolk sac EryC; light gray bars: ln2-Iknull yolk sac EryC; white bars: isotype-matched Ig (Ig ctl).
Figure 5.
Figure 5.
PIC assembly at huγ-genes in ln2 and ln2-Iknull yolk sac EryC. (A–C) ChIP on ln2 and ln2-Iknull yolk sac EryC carried out with TBP, Pol II and Pol II phospho Ser2 (PCTD) antibodies; fold enrichments (y-axis) were calculated as described in Figure 1E and are plotted as the mean ± SD of the measurements; a value of 1 (dashed line) indicates no enrichment; *P ≤ 0.05 by Student’s t-test; huε, huε-promoter; huγ, huγ-promoters; huγg, huγ-genes; huβ, huβ-promoter; Gpa, Glycophorin A promoter; dark gray bars: ln2 yolk sac EryC; light gray bars: ln2-Iknull yolk sac EryC; white bars: isotype-matched Ig (Ig ctl); (D) RT–qPCR of huγ-gene 5′- and 3′-primary transcripts performed on equal amounts of ln2 and ln2-Iknull yolk sac EryC using random primers for cDNA synthesis; transcript quantification was calculated according to Pfaffl (73) using the huγ-globin specific primer sets (Pr) depicted as colored bars and mouse Gapdh primary transcripts as internal control; ratios are plotted as the mean ± SD of the measurements; n ≥ 3; P ≤ 0.05; Ex: indicates the three exons of the huγ-gene.
Figure 6.
Figure 6.
Ikaros-mediated recruitment of Cdk9 to the huγ-genes in yolk sac EryC. (A) ChIP on ln2 and ln2-Iknull yolk sac EryC carried out with Cdk9 antibodies; fold enrichments (y-axis) were calculated as described in Figure 1E and are plotted as the mean ± SD of the measurements; a value of 1 (dashed line) indicates no enrichment; *P ≤ 0.05 by Student’s t-test; huε, huε-promoter; huγ, huγ-promoters; huβ, huβ-promoter; βma, βmajor promoter; dark gray bars: ln2 yolk sac EryC; light gray bars: ln2-Iknull yolk sac EryC; dark gray dashed bars: MEL cells; white bars: isotype-matched Ig (Ig ctl); (B) RT–qPCR of Cdk9 gene transcripts performed on equal amounts of ln2 and ln2-Iknull yolk sac EryC; transcript quantification was calculated according to Pfaffl (73) using mouse Actin cDNA as internal control; ln2/ln2-Iknull ratios are plotted as the mean ± SD of the measurements; n = 6; (C) WB performed on total cell lysates prepared from wild type or Iknull yolk sac EryC with Cdk9 or Actin antibodies; (D) protein co-IP of total cell lysates prepared from ln2 yolk sac EryC; cell lysates were immunoprecipitated with Cdk9 antibodies or isotype-matched Ig and WB were carried out with Ikaros antibodies; WCE: yolk sac EryC total cell lysate; (E) Confocal immunofluorescence of COS-7 cells expressing Flag/HA-Ikaros protein; cells were stained with mouse antibodies to the HA tag and with rabbit antibodies to Cdk9; the secondary staining was carried out with FITC-conjugated anti-mouse as well as TR-conjugated anti-rabbit antibodies; a single COS-7 cell is shown where Ikaros is detected as green signals, Cdk9 as red signals, and Ikaros-Cdk9 co-localization as yellow signals in the magnified merged image; line profile plots of Ikaros (in green) and Cdk9 (in red) were obtained by the WCIF ImageJ(®) program (NIH).
Figure 7.
Figure 7.
Ikaros interacts with Cdk9 in Jurkat and COS-7 cell lines. (A) WB performed on total cell lysates prepared from Jurkat cells (Ju) or Jurkat cells stably transfected with the pOZN-FH-Ik expression vector (Ju/Ik); endogenous (Ik) as well as double Flag/HA-Ikaros-specific bands (FH-Ik) are indicated; (B) Protein co-IP of total cell lysates prepared from Ju/Ik cells; filled circles represent Ig bands; WCE: Ju/Ik total cell lysate; (C) Protein co-IP of total cell lysates prepared from MEL cells; I, Input; M20, anti-Gata-1 antibodies, clone M20; N6, anti-Gata-1 antibodies, cloneN6; Ig, isotype-matched Ig; (D and E) Protein co-IP of total cell lysates prepared from COS-7 cells transfected (Tr) with empty vector (mock, M), Flag/HA-Ikaros (Ik), Gata-1 (G1) or Flag/HA-Ikaros together with Gata-1 (G/Ik); antibodies used for protein co-IP (IP) and WB are indicated on each panel; I, Input; M20, anti-Gata-1 antibodies, clone M20; N6, anti-Gata-1 antibodies, cloneN6; filled circles represent Ig bands.

References

    1. Keys JR, Tallack MR, Zhan Y, Papathanasiou P, Goodnow CC, Gaensler KM, Crossley M, Dekker J, Perkins AC. A mechanism for Ikaros regulation of human globin gene switching. Br. J. Haematol. 2008;141:398–406. - PubMed
    1. Ng SY, Yoshida T, Georgopoulos K. Ikaros and chromatin regulation in early hematopoiesis. Curr. Opin. Immunol. 2007;19:116–122. - PubMed
    1. Harker N, Naito T, Cortes M, Hostert A, Hirschberg S, Tolaini M, Roderick K, Georgopoulos K, Kioussis D. The CD8alpha gene locus is regulated by the Ikaros family of proteins. Mol. Cell. 2002;10:1403–1415. - PubMed
    1. Molnar A, Georgopoulos K. The Ikaros gene encodes a family of functionally diverse zinc finger DNA-binding proteins. Mol. Cell Biol. 1994;14:8292–8303. - PMC - PubMed
    1. Sun L, Liu A, Georgopoulos K. Zinc finger-mediated protein interactions modulate Ikaros activity, a molecular control of lymphocyte development. EMBO J. 1996;15:5358–5369. - PMC - PubMed

Publication types

MeSH terms