

Imaging colon cancer response following treatment with AZD1152: a preclinical analysis of [18F]fluoro-2-deoxyglucose and 3'-deoxy-3'-[18F]fluorothymidine imaging
- PMID: 21245090
- PMCID: PMC3079195
- DOI: 10.1158/1078-0432.CCR-10-1430
Imaging colon cancer response following treatment with AZD1152: a preclinical analysis of [18F]fluoro-2-deoxyglucose and 3'-deoxy-3'-[18F]fluorothymidine imaging
Abstract
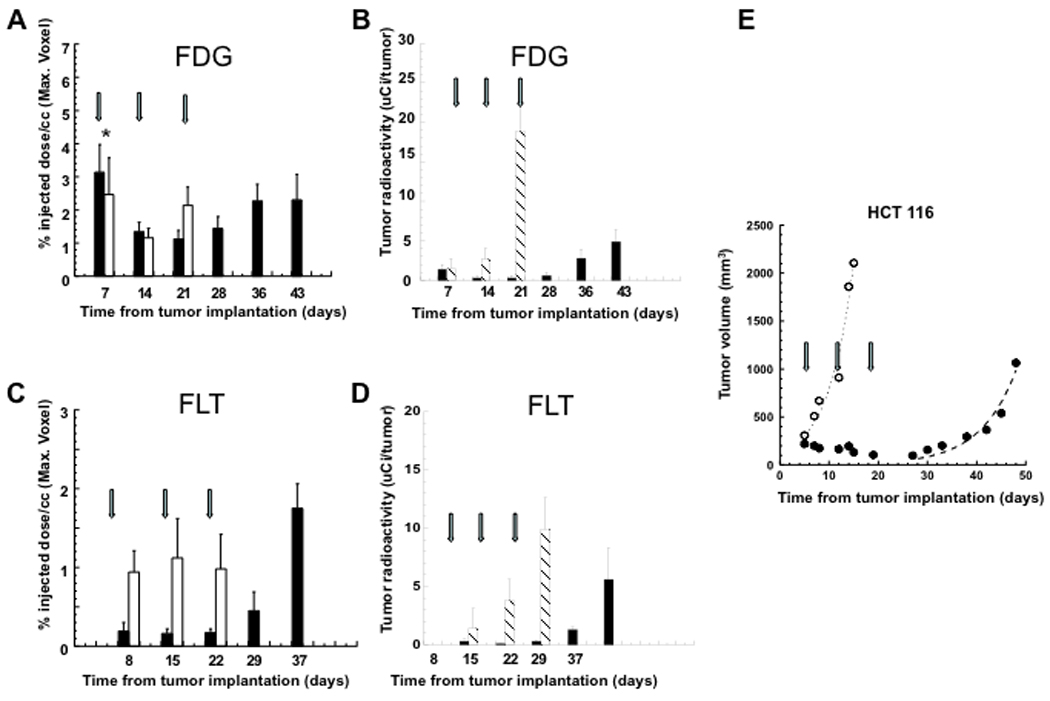
Purpose: To determine whether treatment response to the Aurora B kinase inhibitor, AZD1152, could be monitored early in the course of therapy by noninvasive [(18)F]-labeled fluoro-2-deoxyglucose, [(18)F]FDG, and/or 3'-deoxy-3'-[(18)F]fluorothymidine, [(18)F]FLT, PET imaging.
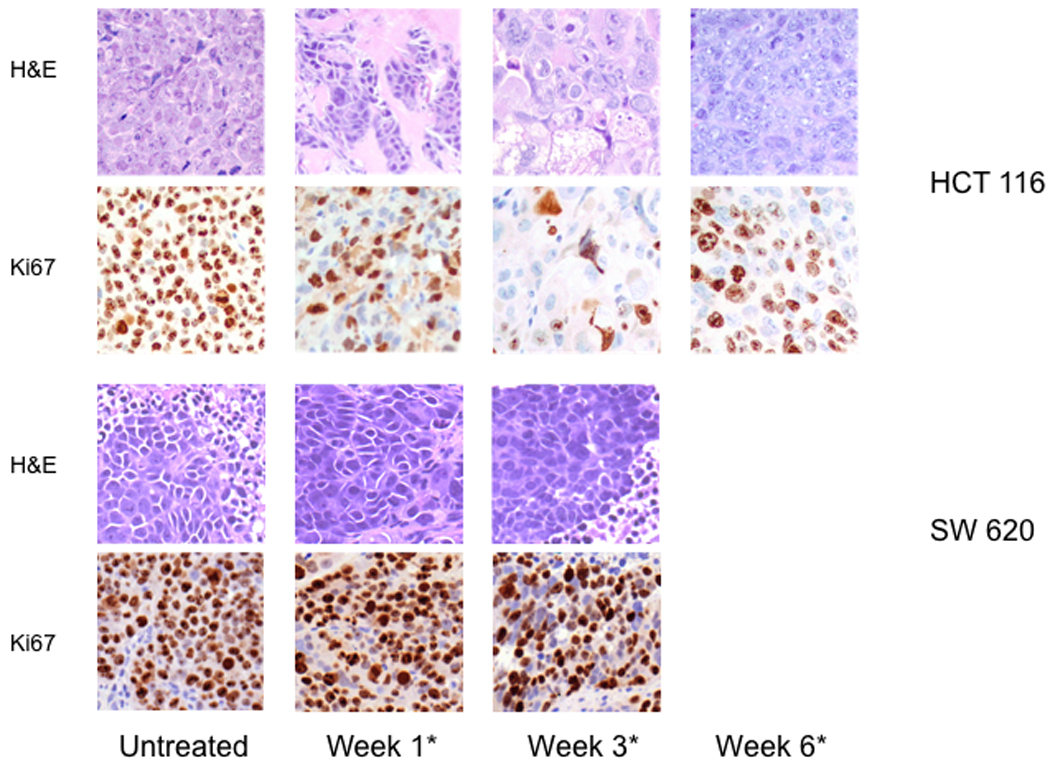
Experimental design: AZD1152-treated and control HCT116 and SW620 xenograft-bearing animals were monitored for tumor size and by [(18)F]FDG, and [(18)F]FLT PET imaging. Additional studies assessed the endogenous and exogenous contributions of thymidine synthesis in the two cell lines.
Results: Both xenografts showed a significant volume-reduction to AZD1152. In contrast, [(18)F]FDG uptake did not demonstrate a treatment response. [(18)F]FLT uptake decreased to less than 20% of control values in AZD1152-treated HCT116 xenografts, whereas [(18)F]FLT uptake was near background levels in both treated and untreated SW620 xenografts. The EC(50) for AZD1152-HQPA was approximately 10 nmol/L in both SW620 and HCT116 cells; in contrast, SW620 cells were much more sensitive to methotrexate (MTX) and 5-Fluorouracil (5FU) than HCT116 cells. Immunoblot analysis demonstrated marginally lower expression of thymidine kinase in SW620 compared with HCT116 cells. The aforementioned results suggest that SW620 xenografts have a higher dependency on the de novo pathway of thymidine utilization than HCT116 xenografts.
Conclusions: AZD1152 treatment showed antitumor efficacy in both colon cancer xenografts. Although [(18)F]FDG PET was inadequate in monitoring treatment response, [(18)F]FLT PET was very effective in monitoring response in HCT116 xenografts, but not in SW620 xenografts. These observations suggest that de novo thymidine synthesis could be a limitation and confounding factor for [(18)F]FLT PET imaging and quantification of tumor proliferation, and this may apply to some clinical studies as well.
©2011 AACR.
Figures


References
-
- Gautschi O, Heighway J, Mack PC, Purnell PR, Lara PN, Jr, Gandara DR. Aurora kinases as anticancer drug targets. Clin Cancer Res. 2008 Mar 15;14(6):1639–1648. - PubMed
-
- Ducat D, Zheng Y. Aurora kinases in spindle assembly and chromosome segregation. Exp Cell Res. 2004 Nov 15;301(1):60–67. - PubMed
-
- Fu J, Bian M, Jiang Q, Zhang C. Roles of Aurora kinases in mitosis and tumorigenesis. Mol Cancer Res. 2007 Jan;5(1):1–10. - PubMed
-
- Kimura M, Matsuda Y, Yoshioka T, Okano Y. Cell cycle-dependent expression and centrosome localization of a third human aurora/Ipl1-related protein kinase, AIK3. J Biol Chem. 1999 Mar 12;274(11):7334–7340. - PubMed
-
- Gautschi O, Mack PC, Davies AM, Lara PN, Jr, Gandara DR. Aurora kinase inhibitors: a new class of targeted drugs in cancer. Clin Lung Cancer. 2006 Sep;8(2):93–98. - PubMed
Publication types
MeSH terms
Substances
Grants and funding
LinkOut - more resources
Full Text Sources
