. 2011 Feb 1;108(5):1943-8.
doi: 10.1073/pnas.1010396108. Epub 2011 Jan 18.

Contractility of the cell rear drives invasion of breast tumor cells in 3D Matrigel

Affiliations

Contractility of the cell rear drives invasion of breast tumor cells in 3D Matrigel

Renaud Poincloux et al. Proc Natl Acad Sci U S A. .

Abstract

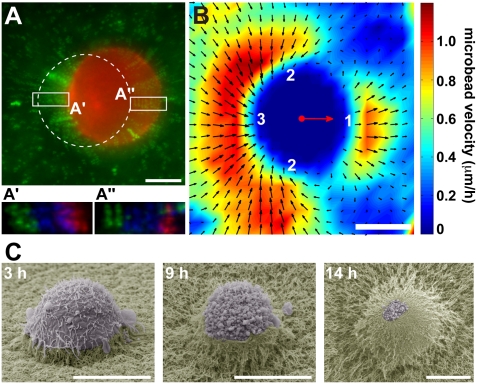
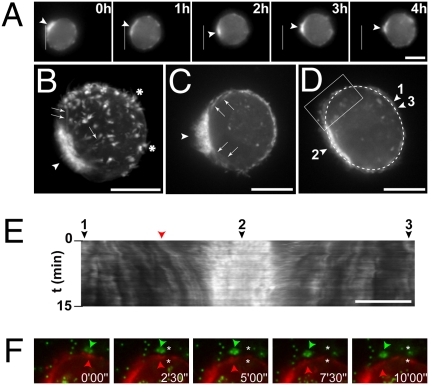
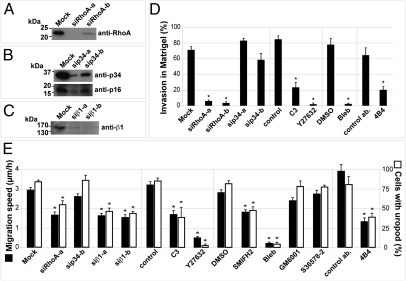
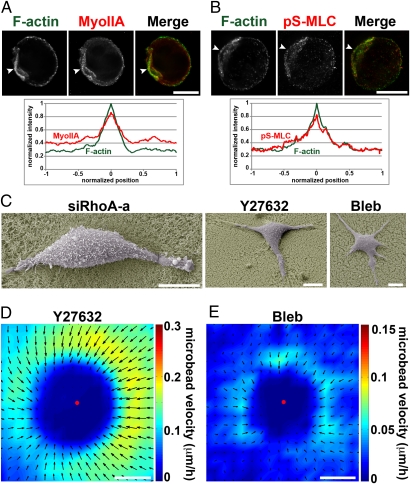
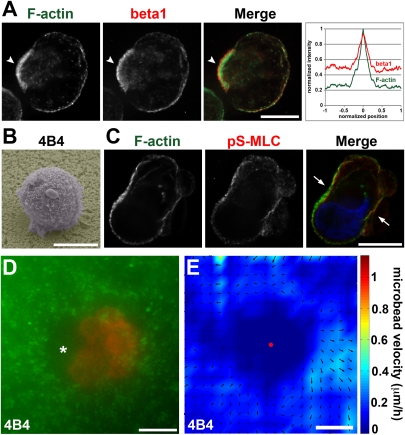
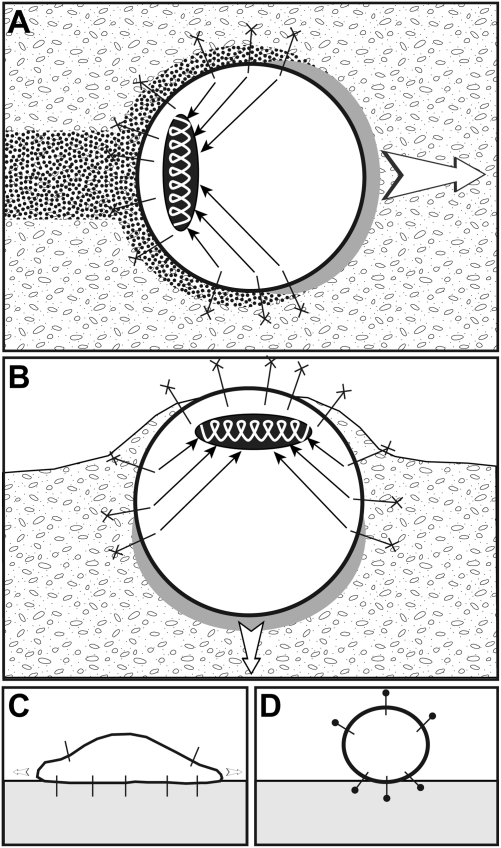
Cancer cells use different modes of migration, including integrin-dependent mesenchymal migration of elongated cells along elements of the 3D matrix as opposed to low-adhesion-, contraction-based amoeboid motility of rounded cells. We report that MDA-MB-231 human breast adenocarcinoma cells invade 3D Matrigel with a characteristic rounded morphology and with F-actin and myosin-IIa accumulating at the cell rear in a uropod-like structure. MDA-MB-231 cells display neither lamellipodia nor bleb extensions at the leading edge and do not require Arp2/3 complex activity for 3D invasion in Matrigel. Accumulation of phospho-MLC and blebbing activity were restricted to the uropod as reporters of actomyosin contractility, and velocimetric analysis of fluorescent beads embedded within the 3D matrix showed that pulling forces exerted to the matrix are restricted to the side and rear of cells. Inhibition of actomyosin contractility or β1 integrin function interferes with uropod formation, matrix deformation, and invasion through Matrigel. These findings support a model whereby actomyosin-based uropod contractility generates traction forces on the β1 integrin adhesion system to drive cell propulsion within the 3D matrix, with no contribution of lamellipodia extension or blebbing to movement.


Conflict of interest statement

The authors declare no conflict of interest.

Figures

Fig. 1.
Fig. 1.
Matrix displacements during MDA-MB-231 rounded cell 3D migration in Matrigel. (A) MDA-MB-231 cells stably expressing mCherry-Lifeact seeded in Matrigel containing fluorescent microbeads (green) were imaged every 15 min (Movie S1). Shown is the last frame of mCh-Lifeact (red) superimposed on a 2-h time projection of the bead sequence (green). Dashed line indicates the position of the cell at the beginning of the time-lapse series. (A′ and A″) Bead positions at the back and front of the cell, respectively, with the first two frames (T0 and T15') color-coded in green, subsequent five frames (T30' to T90') in blue, and last two frames (T105' and T120') of the time series in red. (B) PIV analysis of matrix displacement around the cells. Individual velocity fields of eight cells were averaged. The mass center of cells is depicted with a red dot. Red arrow corresponds to the mean velocity vector of the cells. The amplitude of the bead velocity is color-coded, and direction of displacements is depicted with arrows. Matrix is pushed at the front (region 1), while it is pulled on the sides and at the back (regions 2 and 3, respectively). (C) Scanning electron micrographs of MDA-MB-231 cells invading a thick layer of Matrigel at indicated time after plating. (Scale bars, 10 μm.)
Fig. 2.
Fig. 2.
F-actin dynamics during MDA-MB-231 rounded cell 3D migration. MDA-MB-231 cells expressing mCh-Lifeact were seeded in Matrigel containing fluorescent microbeads (green in F) and imaged by wide-field (A) or confocal spinning disk (BF) microscopy. (A) Selected frames from a time-lapse sequence with the white line showing the position of the rear of the cell at the beginning of the sequence. Arrowheads point to accumulation of F-actin at the cell rear in a uropod-like structure. (B) Z-projection of confocal sections (see Movie S3 for 3D reconstruction) showing the accumulation of F-actin at the uropod (arrowhead), in finger-like cortical extensions (asterisks), and in bundles radiating from the uropod toward the cortex (arrows). (C) Selected frame of a time-lapse series (Movie S4) showing intense blebbing activity restricted to the uropod region (arrowheads). Arrows point to radial F-actin bundles. (D and E) Selected frame (D) of a time-lapse series (Movie S6) showing the dashed line used for kymographic analysis of cortical movements in E (tags 1–3 are positioned on the x axis of the kymograph, as well as the cortical structure highlighted in F, shown by a red arrowhead). (F) Selected frames from the time series as in D and E (Movie S6). The region depicted is boxed in D. Images show F-actin labeled with mCh-Lifeact (red) and microbeads (green). Arrowheads point to parallel rearward movement of a cortical actin structure (red arrowhead) and microbeads (green arrowhead). Asterisks, position of the objects at time 0. (Scale bars, 10 μm.)
Fig. 3.
Fig. 3.
Inhibition of RhoA-ROCK-Myosin II and β1 integrin impairs uropod formation and invasion in Matrigel. (A–C) MDA-MB-231 cells were treated with the indicated siRNAs targeting RhoA (A), the p34-Arc (ARPC2) subunit of the Arp2/3 actin nucleating complex (B), or β1 integrin (C). Cell lysates were prepared after 72 h, and immunoblotting analysis was performed with indicated antibodies. Of note, knockdown of p34-Arc leads to decreased expression of p16-Arc (B). (D) Quantification of cell invasion by mCh-Lifeact MDA-MB-231 cells plated atop of a thick layer of Matrigel and treated with indicated siRNAs or drugs. Cell invasion was determined by analyzing the proportion of cells buried in Matrigel after 14 h from low magnification scanning electron micrographs. (E) Average migration speed (filled bars) and percentage of cells with uropod (open bars) in MDA-MB-231 cells seeded in Matrigel and treated with indicated siRNA and drugs. Asterisks indicate statistically significant differences compared with control cell populations (Tables S1S3).
Fig. 4.
Fig. 4.
Actomyosin-based contractility is required for MDA-MB-231 cell invasion. (A and B) MDA-MB-231 cells seeded in Matrigel for 4 h, fixed, and stained for F-actin and myosin IIA (A) or pS-MLC (B). Arrowheads point to accumulation of myosin IIA and pS-MLC at F-actin positive uropod. Averaged normalized intensity profiles from 15 cells are shown. Position 0 corresponds to maximum normalized F-actin intensity (see SI Methods for details). For clarity, SEMs are not represented (< ±0.08 normalized intensity arbitrary unit). (C) Scanning electron micrographs of siRhoA-, Y27632-, or blebbistatin (bleb)-treated MDA-MB-231 cells seeded atop of Matrigel and fixed after 14 h. (D and E) Individual velocity fields of 13 Y27632-treated cells (D) or 4 blebbistatin-treated cells (E) were averaged as in Fig. 1B. Amplitude of the bead velocity is color-coded, and direction of displacements is depicted with arrows. (Scale bars, 10 μm.)
Fig. 5.
Fig. 5.
Role of β1 integrin in 3D migration of MDA-MB-231 cells in Matrigel. (A) MDA-MB-231 cells were incubated for 4 h in Matrigel, fixed, and stained for F-actin and β1 integrin. Arrowheads point to accumulation of β1 integrin at F-actin–rich uropod. Averaged normalized intensity profiles from 15 cells are shown as in Fig. 4 A and B. (B) Scanning electron micrographs of an MDA-MB-231 cell plated atop a thick layer of Matrigel in the presence of β1 integrin blocking antibody (4B4) for 14 h before fixation. (C) MDA-MB-231 cell seeded in Matrigel for 4 h in the presence of 4B4 antibody and stained for F-actin (green) and pS-MLC (red). Nucleus was labeled with DAPI (blue). Cells adopt irregular shapes with F-actin and pS-MLC accumulations and blebbing activity. (D) mCh-Lifeact MDA-MB-231 cells seeded in Matrigel in the presence of 4B4 mAb were imaged during 4 h by wide-field video microscopy. Shown is the superimposition of the 4-h time projection of the bead sequence and the last frame of mCh-Lifeact sequence. Asterisk points to region of cell detachment to the matrix. (E) Individual velocity fields of seven 4B4-treated cells were averaged as in Fig. 1B. Amplitude of the bead velocity is color-coded, and direction of displacements is depicted with arrows. (Scale bars, 10 μm.)
Fig. 6.
Fig. 6.
Model of breast cancer round cell invasion and migration in 3D Matrigel. (A) MDA-MB-231 cells invade through Matrigel maintaining a spheroid shape. Actomyosin contractility is restricted to the cell rear (ellipsoid spring), generating tractional forces that are transmitted to the matrix through radial F-actin bundles (arrows) and β1 integrins bound to their matrix ligands (cross at the extremity of integrins). Gray and dotted areas represent regions of matrix compression and remodeling induced by cell movement, respectively. (B) Vertical invasion of cells atop a thick layer of Matrigel. (C) Inhibition of actomyosin contractility leads to cells spreading on the surface of Matrigel. (D) Inhibition of β1 integrin binding to its ligand(s) in the matrix (closed circle at the extremity of integrins) results in spheroid cells having minimal contact with the matrix and unable to invade. See text for details.

References

    1. Friedl P, Wolf K. Tumour-cell invasion and migration: Diversity and escape mechanisms. Nat Rev Cancer. 2003;3:362–374. - PubMed
    1. Rowe RG, Weiss SJ. Breaching the basement membrane: Who, when and how? Trends Cell Biol. 2008;18:560–574. - PubMed
    1. Poincloux R, Lizárraga F, Chavrier P. Matrix invasion by tumour cells: A focus on MT1-MMP trafficking to invadopodia. J Cell Sci. 2009;122:3015–3024. - PubMed
    1. Lauffenburger DA, Horwitz AF. Cell migration: A physically integrated molecular process. Cell. 1996;84:359–369. - PubMed
    1. Charras G, Paluch E. Blebs lead the way: how to migrate without lamellipodia. Nat Rev Mol Cell Biol. 2008;9:730–736. - PubMed

Publication types