. 2011 Jan 18:7:461.
doi: 10.1038/msb.2010.116.

Proteome-wide systems analysis of a cellulosic biofuel-producing microbe

Affiliations

Proteome-wide systems analysis of a cellulosic biofuel-producing microbe

Andrew C Tolonen et al. Mol Syst Biol. .

Abstract

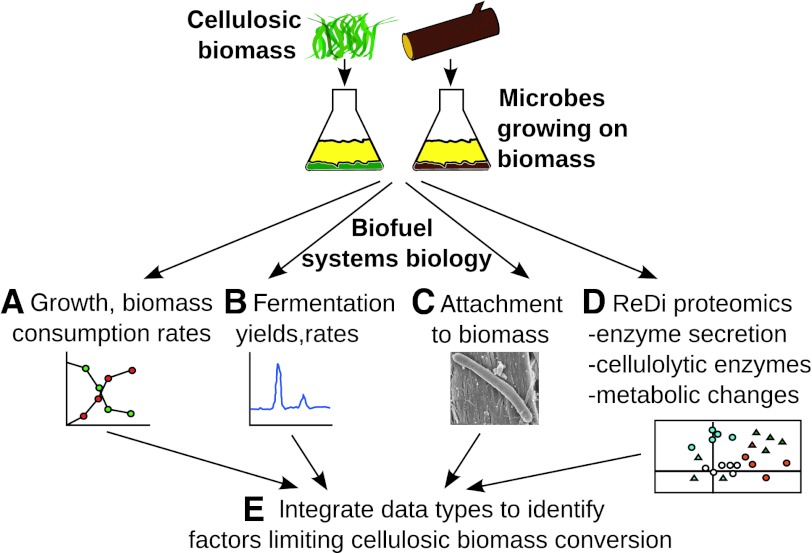
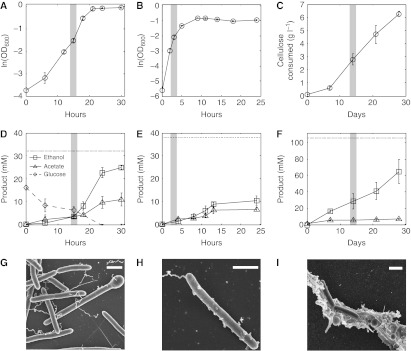
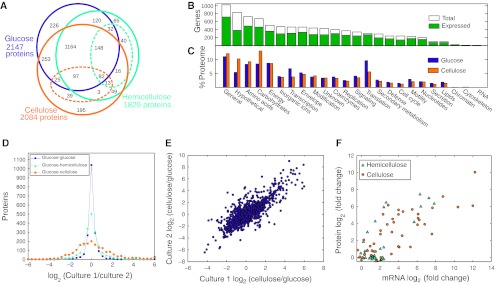
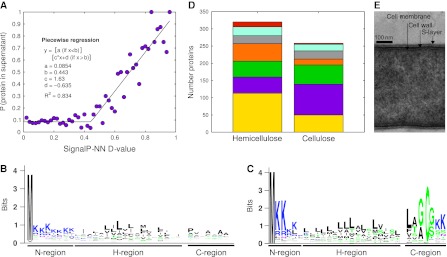
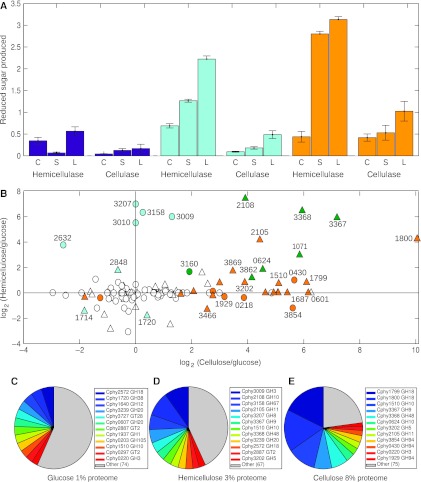
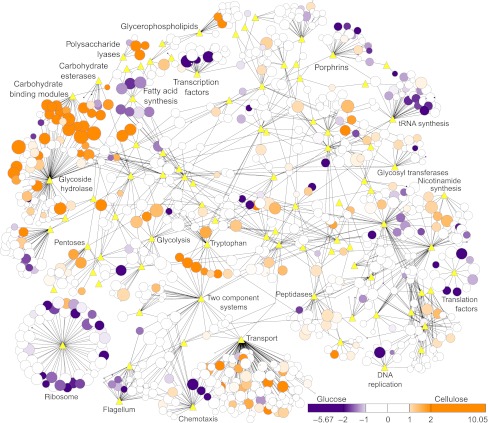
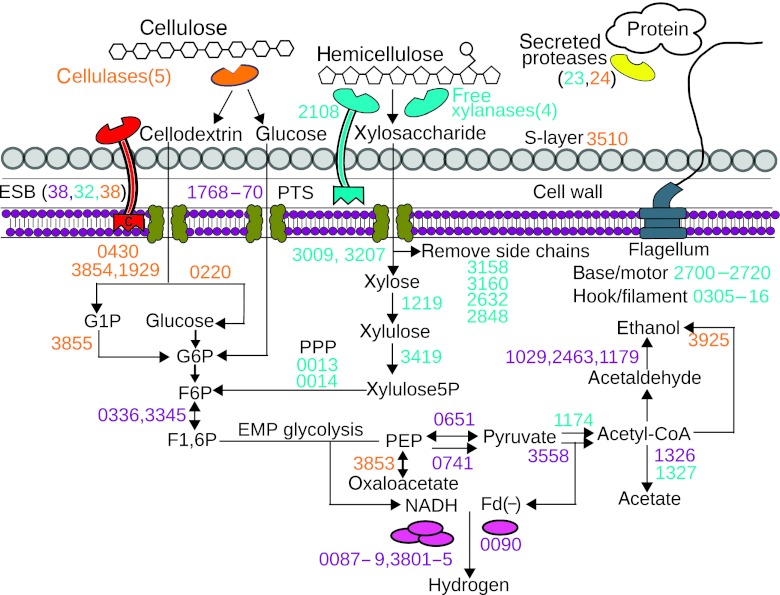
Fermentation of plant biomass by microbes like Clostridium phytofermentans recycles carbon globally and can make biofuels from inedible feedstocks. We analyzed C. phytofermentans fermenting cellulosic substrates by integrating quantitative mass spectrometry of more than 2500 proteins with measurements of growth, enzyme activities, fermentation products, and electron microscopy. Absolute protein concentrations were estimated using Absolute Protein EXpression (APEX); relative changes between treatments were quantified with chemical stable isotope labeling by reductive dimethylation (ReDi). We identified the different combinations of carbohydratases used to degrade cellulose and hemicellulose, many of which were secreted based on quantification of supernatant proteins, as well as the repertoires of glycolytic enzymes and alcohol dehydrogenases (ADHs) enabling ethanol production at near maximal yields. Growth on cellulose also resulted in diverse changes such as increased expression of tryptophan synthesis proteins and repression of proteins for fatty acid metabolism and cell motility. This study gives a systems-level understanding of how this microbe ferments biomass and provides a rational, empirical basis to identify engineering targets for industrial cellulosic fermentation.


Conflict of interest statement

The authors declare that they have no conflict of interest.

Figures

Figure 1
Figure 1
Integrated systems biology strategy to study cellulosic bioconversion. Cultures metabolizing different biomass substrates were examined for (A) growth and biomass consumption rates (Figure 2A–C), (B) fermentation production rates and yields (Figure 2D–F), and (C) ability of the microbe to adhere to cellulosic substrates (Figure 2G–I). (D) Supernatant and cellular protein samples were taken for reductive dimethylation (ReDi) proteomics and analyzed for enzyme secretion (Figure 4), abundances of cellulolytic enzymes (Figure 5), and proteome-wide changes (Figure 6). (E) These data were integrated to identify key enzymes for each step in biomass deconstruction and fermentation (Table I, Figure 7).
Figure 2
Figure 2
Growth (AC), fermentation (DF), and cell morphology (GI) of C. phytofermentans on different carbon sources. Data points are means of triplicate cultures; error bars show one s.d. and are smaller than the symbols where not apparent. Gray bars show when samples were taken for mass spectrometry. Growth on glucose (A) and hemicellulose (B) was quantified as OD600. Growth on cellulose (C) was measured as dry mass of cellulose in culture. Production of ethanol and acetate, the two most abundant fermentation products, and glucose consumption in the glucose treatment was measured by HPLC. Dotted lines show maximum theoretical yield of ethanol. Scanning electron microscopy shows cells growing on glucose (G), hemicellulose (H), and cellulose (I). White scale bar is 1 μm.
Figure 3
Figure 3
Protein identification (AC) and quantification (DF) by mass spectrometry. (A) Venn diagram of proteins identified in each treatment. Protein subsets in the hemicellulose and cellulose culture supernatants are shown with dashed ellipses. In total, 2567 of 3926 (65%) putative proteins were detected. (B) The 65% overall protein identification rate is conserved across Clusters of Orthologous Genes (COG) functional categories. (C) The percent of the proteome shown as summed Absolute Protein EXpression (APEX) values in each COG category for cells growing on glucose and cellulose. (D) Relative protein expression in different cultures quantified by ReDi labeling. The fraction of proteins expressed within twofold levels for the glucose treatment compared with a duplicate glucose culture (94%), hemicellulose (80%), and cellulose (49%) cultures. (E) Fold change in protein expression (MS1 peak area ratio, MPA ratio) for cellulose versus glucose duplicate cultures is highly correlated (r2=0.82). (F) Scatter plot of mRNA versus protein expression of 40 carbohydrate-active enzymes on cellulose (orange circles, r2=0.77) and hemicellulose (turquoise triangles, r2=0.71) versus glucose. The mRNA fold change was measured by qRT–PCR (−ΔΔCt).
Figure 4
Figure 4
The C. phytofermentans secretome. (A) Proteins with high-scoring N-terminal signal peptides have a greater probability of being in culture supernatants. Fraction of proteins in proteome at each SignalP-NN D value observed in the supernatants of hemicellulose or cellulose cultures. Data were fit to a piecewise linear regression with the leftmost regression to a horizontal line. Consensus sequences of (B) type I and (C) type II lipoprotein N-terminal signal peptides for proteins found in the supernatant of cellulose cultures. (D) Functional categories of proteins in culture supernatants: rust, flagellum; turquoise, cell wall/surface; gray, proteases; orange, transport; green, CAZy; purple, other; gold, unknown. (E) Transmission electron micrograph of a C. phytofermentans cell cross section showing the cell membrane, cell wall, and surface layer.
Figure 5
Figure 5
Carbohydrate-active enzyme (CAZy) expression and activities in glucose, hemicellulose, and cellulose cultures. (A) Secreted and cellular cellulolytic enzyme activities. Protein lysates from cultures grown on glucose (purple), hemicellulose (turquoise), or cellulose (orange) prepared from the cellular fraction (C), supernatant (S), or whole-culture lystates (L). Proteins were incubated with hemicellulose (hemicellulase assay) or carboxymethylcellulose substrate (cellulase assay), reducing sugars were assayed using dinitrosalicyclic acid, and were normalized to protein concentration. (B) CAZy expression changes (MS1 peak area ratio, MPA ratio) on hemicellulose and cellulose versus glucose showing differentially expressed proteins (P<0.01) on hemicellulose (turquoise), cellulose (orange), or both (green). Symbols show cellular proteins (circles) and supernatant proteins (triangles). (CE) Shifts in the relative abundances of CAZy proteins in glucose (C) hemicellulose (D), and cellulose (E) treatments by Absolute Protein EXpression (APEX) show acclimation to different carbon sources. Fraction of proteome comprised of CAZy proteins in each treatment is shown.
Figure 6
Figure 6
Proteome-wide expression changes on cellulose versus glucose visualized as a Cytoscape interaction network (Shannon et al, 2003). Nodes are proteins (circles) or KEGG/carbohydrate-active enzyme (CAZy) categories (yellow diamonds); edges are protein interactions defined by KEGG or CAZy databases. Protein node sizes show expression on cellulose as log2 (Absolute Protein EXpression, APEX). Node colors are expression changes as cellulose/glucose log2 protein ratios (MS1 peak area ratio, MPA ratio). Proteins less than twofold changed are white, higher on cellulose are graded orange, and higher on glucose are graded purple (see legend).
Figure 7
Figure 7
Model of the key secreted and intracellular proteins for the degradation and fermentation of plant biomass. Protein ID numbers are colored by highest Absolute Protein EXpression (APEX) expression on glucose (purple), hemicellulose (turquoise), cellulose (orange). Number in parentheses show the number of proteins of related function.

References

    1. Bakalarski CE, Elias JE, Villén J, Haas W, Gerber SA, Everley PA, Gygi SP (2008) The impact of peptide abundance and dynamic range on stable-isotope-based quantitative proteomic analyses. J Proteome Res 7: 4756–4765 - PMC - PubMed
    1. Bendtsen JD, Nielsen H, von Heijne G, Brunak S (2004) Improved prediction of signal peptides: SignalP 3.0. J Mol Biol 340: 783–795 - PubMed
    1. Blouzard JC, Coutinho PM, Fierobe HP, Henrissat B, Lignon S, Tardif C, Pagès S, de Philip P (2010) Modulation of cellulosome composition in Clostridium cellulolyticum: adaptation to the polysaccharide environment revealed by proteomic and carbohydrate-active enzyme analyses. Proteomics 10: 541–554 - PubMed
    1. Boersema PJ, Raijmakers R, Lemeer S, Mohammed S, Heck AJR (2009) Multiplex peptide stable isotope dimethyl labeling for quantitative proteomics. Nat Protoc 4: 484–494 - PubMed
    1. Cantarel BL, Coutinho PM, Rancurel C, Bernard T, Lombard V, Henrissat B (2009) The Carbohydrate-Active EnZymes database (CAZy): an expert resource for Glycogenomics. Nucleic Acids Res 37: D233–D238 - PMC - PubMed

Publication types

MeSH terms

LinkOut - more resources