. 2011 Jan 5;6(1):e15859.
doi: 10.1371/journal.pone.0015859.

Pressure load: the main factor for altered gene expression in right ventricular hypertrophy in chronic hypoxic rats

Affiliations

Pressure load: the main factor for altered gene expression in right ventricular hypertrophy in chronic hypoxic rats

Jonas D Baandrup et al. PLoS One. .

Abstract

Background: The present study investigated whether changes in gene expression in the right ventricle following pulmonary hypertension can be attributed to hypoxia or pressure loading.

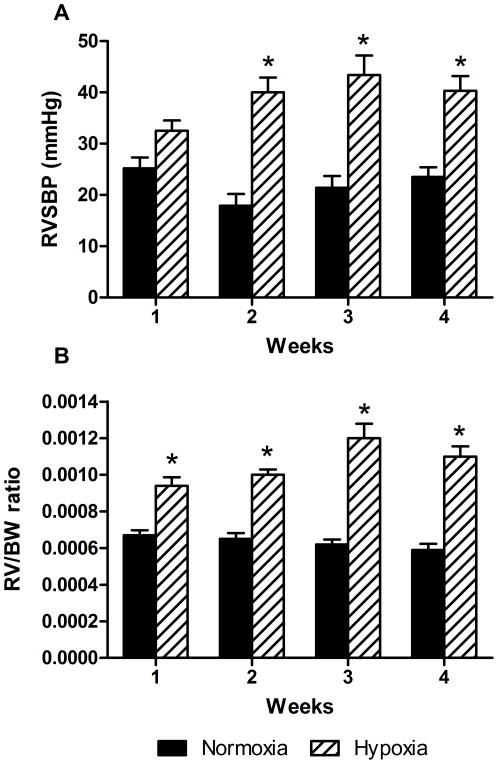
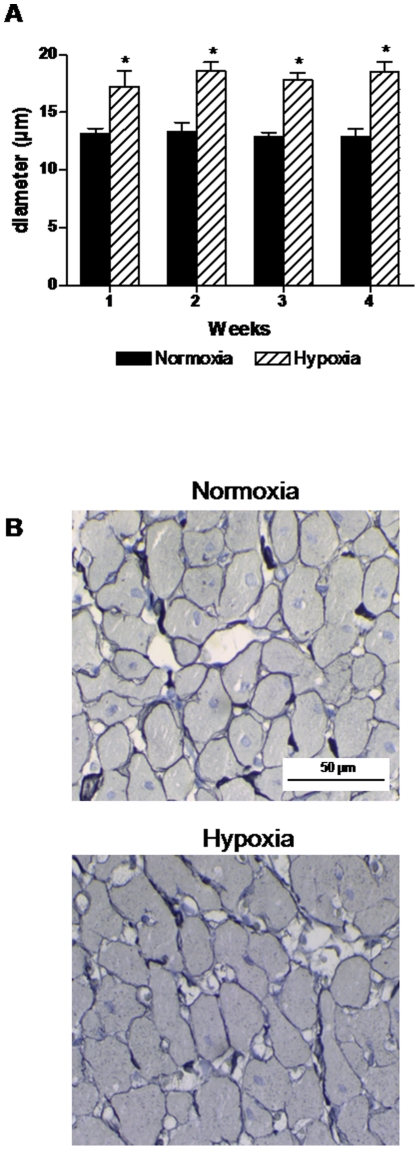
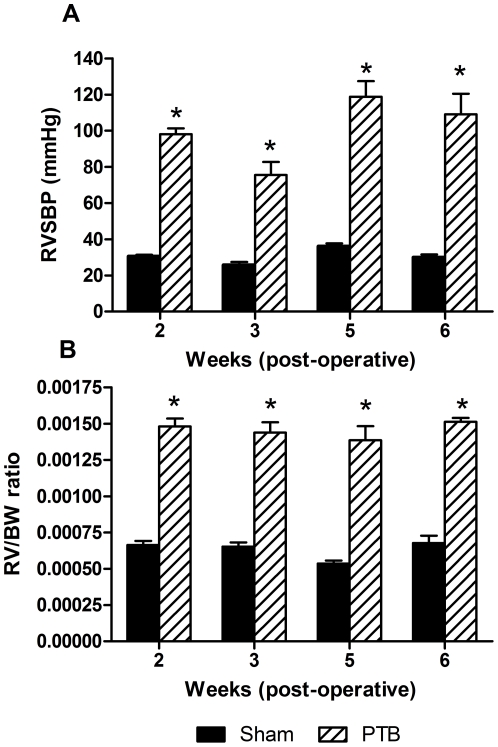
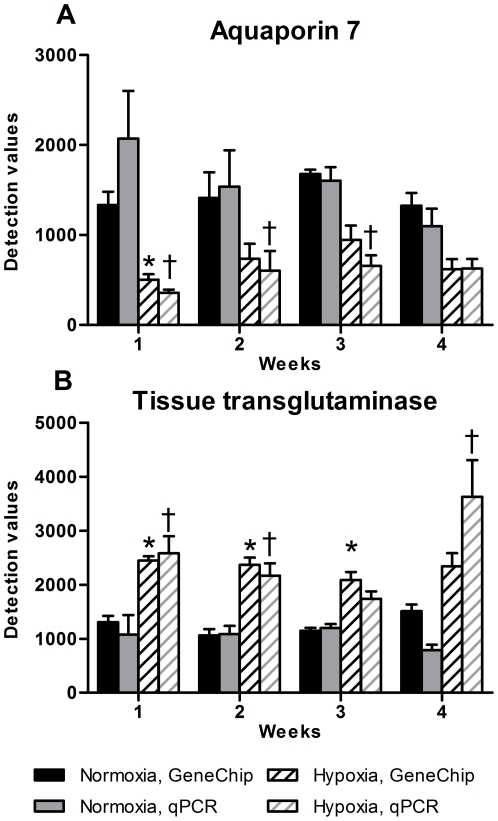
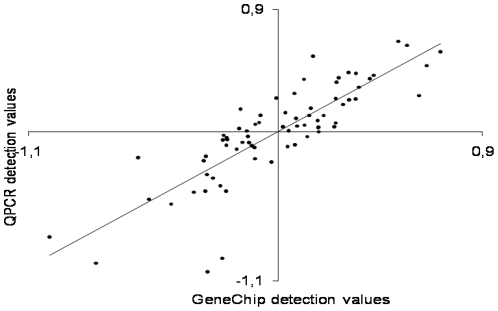
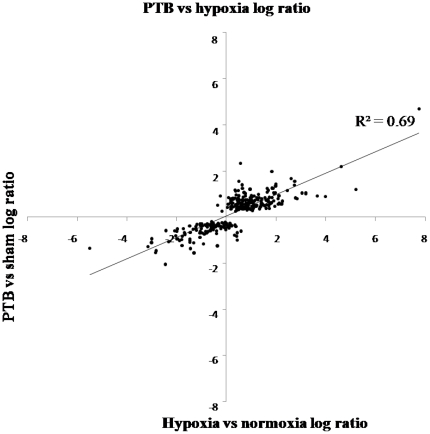
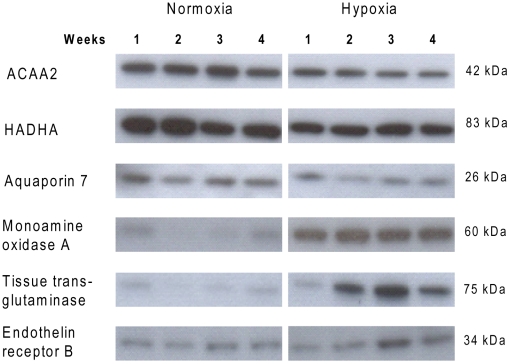
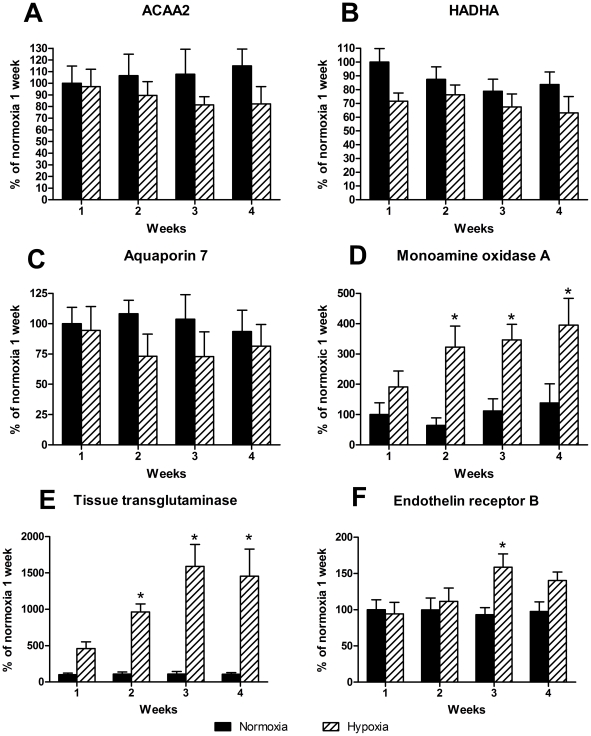
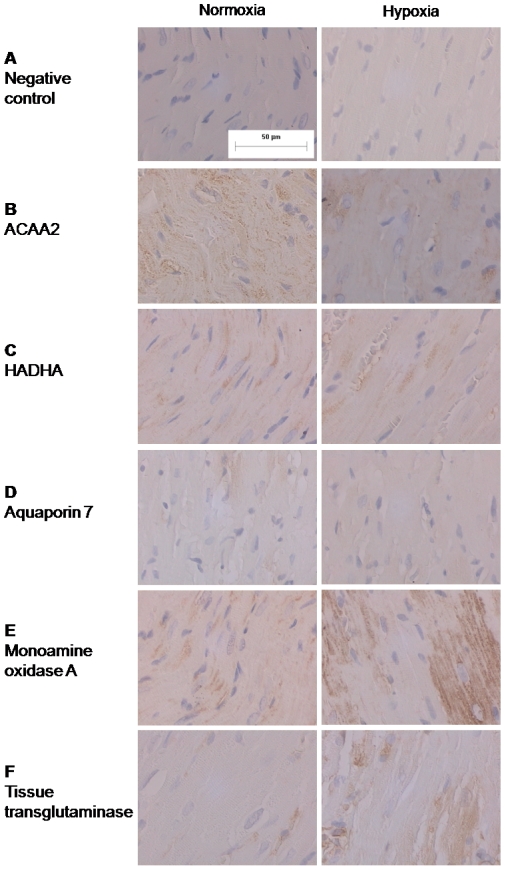
Methodology/principal findings: To distinguish hypoxia from pressure-induced alterations, a group of rats underwent banding of the pulmonary trunk (PTB), sham operation, or the rats were exposed to normoxia or chronic, hypobaric hypoxia. Pressure measurements were performed and the right ventricle was analyzed by Affymetrix GeneChip, and selected genes were confirmed by quantitative PCR and immunoblotting. Right ventricular systolic blood pressure and right ventricle to body weight ratio were elevated in the PTB and the hypoxic rats. Expression of the same 172 genes was altered in the chronic hypoxic and PTB rats. Thus, gene expression of enzymes participating in fatty acid oxidation and the glycerol channel were downregulated. mRNA expression of aquaporin 7 was downregulated, but this was not the case for the protein expression. In contrast, monoamine oxidase A and tissue transglutaminase were upregulated both at gene and protein levels. 11 genes (e.g. insulin-like growth factor binding protein) were upregulated in the PTB experiment and downregulated in the hypoxic experiment, and 3 genes (e.g. c-kit tyrosine kinase) were downregulated in the PTB and upregulated in the hypoxic experiment.

Conclusion/significance: Pressure load of the right ventricle induces a marked shift in the gene expression, which in case of the metabolic genes appears compensated at the protein level, while both expression of genes and proteins of importance for myocardial function and remodelling are altered by the increased pressure load of the right ventricle. These findings imply that treatment of pulmonary hypertension should also aim at reducing right ventricular pressure.


Conflict of interest statement

Competing Interests: The authors have declared that no competing interests exist.

Figures

Figure 1
Figure 1. Right ventricular systolic blood pressure (RVSBP) and right ventricular hypertrophy in hypoxic experiment.
A: changes in RVSBP in the normoxic and hypoxic groups at the four time points. RVSBP was constant in the normoxic group and significantly increased in the hypoxic groups after 2 weeks. B: temporal change in right ventricular hypertrophy in the hypoxic experiment assessed by right ventricular weight relative to body weight ratio (RV/BW) shows significant increase due to hypoxia. n = 6 in both groups at all time points. Values are means ± SE. *P<0.05 vs. normoxia at same time point.
Figure 2
Figure 2. Morphometric measurements of the right ventricle.
A: cardiomyocyte diameter was significantly increased by hypoxia compared to normoxic controls. B: examples of staining with reticulin in right ventricle samples from normoxic and hypoxic rats. n = 5–6 in both groups at all time points. Values are means ± SE. *P<0.05 vs. normoxia at same time point.
Figure 3
Figure 3. RVSBP and RV/BW in the pulmonary trunk banding (PTB) experiment.
A: RVSBP was significantly increased due to PTB compared to sham operated animals. B: temporal change in right ventricular hypertrophy in the PTB experiment assessed by RV/BW and compared to the sham group shows a significant increasing effect of PTB. n = 4–7 in both groups at all time points. Values are means ± SE. *P<0.05 vs. sham at same time point.
Figure 4
Figure 4. qPCR analysis of aquaporin7 and tissue transglutaminase.
A: gene expression of the aquaporin 7 mRNA by use of gene chip and qPCR shows a decrease in gene expression according to hypoxia. B: gene expression of tissue transglutaminase mRNA by use of gene chip and qPCR shows the opposite impact of hypoxia by increasing gene expression. n = 6 in both groups at all time points.
Figure 5
Figure 5. Correlation of the gene chip and qPCR gene expression results.
The correlation is tested by comparing three upregulated, four downregulated and two not regulated genes (according to the gene chip, tsum analysis). There was found significant correlation between qPCR and gene chip analysis. Values are means ± SE. *P<0.05 vs. normoxia, gene chip at same time point, †P<0.05 vs. normoxia, qPCR at same time point.
Figure 6
Figure 6. Log ratio of gene chip data obtained in the right ventricle of chronic hypoxic compared to normoxic rats versus pulmonary trunk banded (PTB) compared to sham-operated rats.
There was found a positive correlation between regulation of the genes in the two experiments with a significant correlation coefficient R2 = 0.69 (P<0.05, n = 288).
Figure 7
Figure 7. Representative immunoblots for proteins measured in the right ventricle from normoxic and hypoxic rats.
ACAA2: acetyl-Coenzyme A acyltransferase 2, HADHA: hydroxyacyl-Coenzyme A dehydrogenase/3-ketoacyl-Coenzyme A thiolase/enoyl-Coenzyme A hydratase (trifunctional protein), alpha subunit.
Figure 8
Figure 8. Immunoblottings of right ventricle samples from normoxic and hypoxic rats.
Proteins participating in metabolism A: ACAA2, B: HADHA and C: aquaporin 7 show tendency to downregulation by hypoxia. D: monoamine oxidase A, E: tissue transglutaminase and F: endothelin receptor B were all upregulated by hypoxia. ACAA2: acetyl-Coenzyme A acyltransferase 2, HADHA: hydroxyacyl-Coenzyme A dehydrogenase/3-ketoacyl-Coenzyme A thiolase/enoyl-Coenzyme A hydratase (trifunctional protein), alpha subunit. Values are means ± SE and are calculated as percent of normoxia 1 week. n = 6 in both groups at all time points. *P<0.05 vs. normoxia at same time point.
Figure 9
Figure 9. Immunostainings of slides from the right ventricle from rats exposed to normoxia or hypoxia for 2 weeks.
A: Negative controls without incubation with the primary antibody. The bar on control picture shows the size reference (50 µm) for all pictures. B: ACAA2 C: HADHA, D: aquaporin 7, E: monoamine oxidase A, F: tissue transglutaminase. All proteins were found to be located to the cardiomyocyte and only aquaporin 7 was thought to be located to the cellular membrane whereas the other proteins is located to the cytosol.

References

    1. Chin KM, Kim NH, Rubin LJ. The right ventricle in pulmonary hypertension. Coron Artery Dis. 2005;16:13–18. - PubMed
    1. Humbert M, Sitbon O, Simonneau G. Treatment of pulmonary arterial hypertension. N Engl J Med. 2004;351:1425–1436. - PubMed
    1. Montalescot G, Drobinski G, Meurin P, Maclouf J, Sotirov I, et al. Effects of prostacyclin on the pulmonary vascular tone and cardiac contractility of patients with pulmonary hypertension secondary to end-stage heart failure. Am J Cardiol. 1998;82:749–755. - PubMed
    1. Kisch-Wedel H, Kemming G, Meisner F, Flondor M, Kuebler WM, et al. The prostaglandins epoprostenol and iloprost increase left ventricular contractility in vivo. Intensive Care Med. 2003;29:1574–1583. - PubMed
    1. Mulder P, Richard V, Derumeaux G, Hogie M, Henry JP, et al. Role of endogenous endothelin in chronic heart failure: effect of long-term treatment with an endothelin antagonist on survival, hemodynamics, and cardiac remodeling. Circulation. 1997;96:1976–1982. - PubMed

Publication types