. 2011 Jan 5;6(1):e15324.
doi: 10.1371/journal.pone.0015324.

Hepatitis B virus lacks immune activating capacity, but actively inhibits plasmacytoid dendritic cell function

Affiliations

Hepatitis B virus lacks immune activating capacity, but actively inhibits plasmacytoid dendritic cell function

Andrea M Woltman et al. PLoS One. .

Abstract

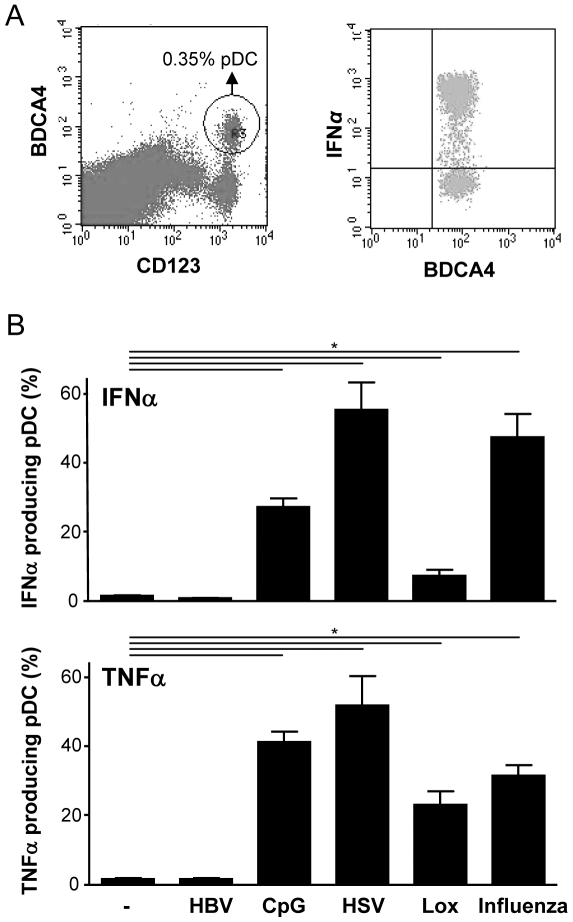
Chronic hepatitis B virus (HBV) infection is caused by inadequate anti-viral immunity. Activation of plasmacytoid dendritic cells (pDC) leading to IFNα production is important for effective anti-viral immunity. Hepatitis B virus (HBV) infection lacks IFNα induction in animal models and patients and chronic HBV patients display impaired IFNα production by pDC. Therefore, HBV and HBV-derived proteins were examined for their effect on human pDC in vitro. In addition, the in vitro findings were compared to the function of pDC derived from chronic HBV patients ex vivo. In contrast to other viruses, HBV did not activate pDC. Moreover, HBV and HBsAg abrogated CpG-A/TLR9-induced, but not Loxoribine/TLR7-induced, mTOR-mediated S6 phosphorylation, subsequent IRF7 phosphorylation and IFNα gene transcription. HBV/HBsAg also diminished upregulation of co-stimulatory molecules, production of TNFα, IP-10 and IL-6 and pDC-induced NK cell function, whereas TLR7-induced pDC function was hardly affected. In line, HBsAg preferentially bound to TLR9-triggered pDC demonstrating that once pDC are able to bind HBV/HBsAg, the virus exerts its immune regulatory effect. HBV not only directly interfered with pDC function, but also indirectly by interfering with monocyte-pDC interaction. Also HBeAg diminished pDC function to a certain extent, but via another unknown mechanism. Interestingly, patients with HBeAg-positive chronic hepatitis B displayed impaired CpG-induced IFNα production by pDC without significant alterations in Loxoribine-induced pDC function compared to HBeAg-negative patients and healthy controls. The lack of activation and the active inhibition of pDC by HBV may both contribute to HBV persistence. The finding that the interaction between pDC and HBV may change upon activation may aid in the identification of a scavenging receptor supporting immunosuppressive effects of HBV and also in the design of novel treatment strategies for chronic HBV.


Conflict of interest statement

Competing Interests: The authors have declared that no competing interest exist.

Figures

Figure 1
Figure 1. HBV does not activate pDC.
A: PBMC were stimulated with CpG and analysed for IFNα production by pDC as described in Materials and Methods . Shown is a representative FACS plot of PBMC stained for CD123 and BDCA-4 to identify pDC and the detection of IFNα positive cells within this pDC-gate. B: IFNα and TNFα producing pDC within PBMC cultured in the presence or absence of HepG2.215-derived HBV, CpG, HSV-1, Lox or Influenza are presented as mean±SEM of 10 independent experiments.
Figure 2
Figure 2. HBV dose-dependently inhibits CpG-induced transcription of IFNα in pDC.
A: IFNα production by pDC cultured in medium, CpG, HSV-1, Lox or Influenza with or without HepG2.215-derived HBV was determined by flow cytometry or ELISA. Mean±SEM of 3 independent experiments. B: CpG-activated pDC were cultured with different doses of HepG2.215-derived HBV. IFNα production determined by ELISA is presented as mean±SEM of 16 independent experiments with different donors. C: pDC were cultured with CpG in the presence or absence of HepG2.215-derived HBV for 3h. Data present the mean±SEM percentage of cells positive for phosphorylated IRF7 from 5 independent experiments. DE: pDC were cultured with CpG in the presence or absence of HepG2.215-derived HBV for 2 or 4h. Data represent IFNα2 (DE) and IFNα8 (E) mRNA levels normalized to GAPDH and are representative for 6 experiments (D) or show the mean±SEM IFNα mRNA levels relative to cultures without HBV (n = 6) (E). *p<0.05, **p<0.01, p<0.001, Wilcoxon signed rank test.
Figure 3
Figure 3. HBV inhibits cytokine production and pDC-induced NK cell activation.
ABCD: Purified pDC were cultured with CpG in the presence or absence HepG2.215-derived HBV. Supernatants were analysed for TNFα (A), IP-10 (B), IL-6 (C) and IL-8 (D). Data demonstrate mean±SEM of 8 independent experiments. EFG: Purified pDC were stimulated with CpG in the presence or absence of patient serum-derived HBV. Healthy control serum was treated in a similar way and added in the same volume to pDC. After 24h, supernatants were harvested and tested for the presence of IFNα (E), TNFα (F) and IL-6 (G) by ELISA. Shown is the mean±SD of triplicate cultures from one out of 2 experiments with different donors. HI: NK cells were cultured with or without pDC and with or without HepG2.215-derived HBV in medium containing IL-3 and CpG. Data show mean±SEM CD25 expression on CD56+ cells (E) and IFNγ production (F) of 7 independent experiments. *p<0.05, Wilcoxon signed rank test.
Figure 4
Figure 4. Monocytes support immune regulatory effect HBV on pDC.
A: PBMC were stimulated with CpG with or without HepG2.215-derived HBV. Data present mean±SEM frequencies of IFNα and TNFα producing pDC of 6 independent experiments. B: PBMC or pDC were cultured with CpG with or without HepG2.215-derived HBV. Mean±SEM intracellular IFNα expression in pDC of 21 independent experiments is shown. *p = 0.01, **p<0.001, Wilcoxon signed rank test. C: PBMC were stimulated with CpG with or without HepG2.215-derived HBV and with or without neutralizing antibodies to IL-10 or IL-10R. The percentages of IFNα producing pDC were determined by flow cytometry. The percentage of cytokine producing pDC in control cultures was set on 1 and the relative production was calculated. Data demonstrate mean±SEM relative IFNα production by pDC (n = 3). DE: pDC were cultured alone or with monocytes (1∶5) and stimulated with CpG either in the presence or absence of HepG2.215-derived HBV (1000 geq/pDC). The percentage of IFNα (D) and TNFα (E) producing pDC were determined by flow cytometry. Due to large variation between donors, the percentage of cytokine producing pDC in control pDC cultures was set on 1 and the relative cytokine production was calculated. Wilcoxon signed rank tests were performed on original data, *P<0.05 (n = 6).
Figure 5
Figure 5. HBsAg and HBeAg inhibit cytokine production by pDC.
pDC were cultured with CpG in the presence or absence of increasing doses or 5 µg/ml of HBcAg, HBeAg or HBsAg. Supernatants were harvested and analysed for IFNα (A), TNFα (B), IP-10 (C), IL-6 (D), and IL-8 (E). Data presented are mean±SEM of at least 8 independent experiments. *P<0.05, Wilcoxon signed rank test compared to control.
Figure 6
Figure 6. Chronic HBV patients display impaired CpG-induced pDC function.
Frozen PBMC from patients (HBV; n = 25) and healthy controls (HC; n = 21) were thawed, washed and cultured in the absence or presence of CpG or Lox and investigated for the production of IFNα by ELISA (AB) or intracellular flow cytometry (CDE) as described in Materials and Methods . For additional analysis of the CpG-induced IFNα producing capacity, the patient group was divided into HBeAg-positive (n = 15) and HBeAg-negative (n = 10) disease. Shown are the mean±SEM IFNα production by HC and patients (A–D) and the relation between serum ALT levels and IFNα producing pDC within the total patient group as defined by Spearman's correlation coefficient. *Mann-Whitney U test, P<0.05.
Figure 7
Figure 7. HBV and HBsAg inhibit CpG-induced S6 phosphorylation.
A: pDC were cultured with CpG in the presence or absence of HepG2.215-derived HBV. Data show the expression of phosphorylated S6 and the mean fluorescence intensity (MFI) and are representative for 8 independent experiments. B: pDC were cultured with or without CpG in the presence or absence of HBcAg, HBeAg, or HBsAg. Data show expression of phosphorylated S6 and the MFI and are representative for 3 independent experiments. C: Data show mean±SEM expression of phosphorylated S6 in BDCA4+CD123+ pDC in PBMC exposed to CpG or Lox in the presence or absence of HepG2.215-derived HBV from 6 independent experiments. *p<0.05, Wilcoxon signed rank test.
Figure 8
Figure 8. HBsAg preferentially binds to CpG-activated pDC.
A: pDC were cultured with or without Lox or CpG and with or without HBsAg. After 4h, cells were harvested and surface bound HBsAg was detected by flow cytometry. Data are representative for 5 independent experiments. Open: HBsAg detection in cultures without HBsAg; Filled: HBsAg detection in cultures with HBsAg. B: PBMC were cultured in the presence of CpG, Lox or HSV-1 either with or without anti-BDCA-2 or BDCA-4. IFNα production in pDC was detected by flow cytometry. Data show mean±SD relative IFNα production compared to cultures without BDCA-2/4 crosslinking for 2 independent experiments. C: pDC were cultured with or without CpG or Lox for 24h. Data show mean±SEM BDCA-2 expression as assessed by flow cytometry of 5 independent experiments. NS: not significant. D: PBMC were cultured with or without CpG and with or without HBsAg. After 4h, cells were harvested and surface bound HBsAg was detected on pDC by flow cytometry. Data show mean±SEM HBsAg positive pDC of 5 independent experiments.

References

    1. Ganem D, Prince AM. Hepatitis B virus infection–natural history and clinical consequences. N Engl J Med. 2004;350:1118–1129. - PubMed
    1. Rehermann B, Nascimbeni M. Immunology of hepatitis B virus and hepatitis C virus infection. Nat Rev Immunol. 2005;5:215–229. - PubMed
    1. Boonstra A, Woltman AM, Janssen HL. Immunology of hepatitis B and hepatitis C virus infections. Best Pract Res Clin Gastroenterol. 2008;22:1049–1061. - PubMed
    1. Garcia-Sastre A, Biron CA. Type 1 interferons and the virus-host relationship: a lesson in detente. Science. 2006;312:879–882. - PubMed
    1. Wieland S, Thimme R, Purcell RH, Chisari FV. Genomic analysis of the host response to hepatitis B virus infection. Proc Natl Acad Sci U S A. 2004;101:6669–6674. - PMC - PubMed

Publication types