. 2011 Jan 5;6(1):e15978.
doi: 10.1371/journal.pone.0015978.

Stiffness gradients mimicking in vivo tissue variation regulate mesenchymal stem cell fate

Affiliations

Stiffness gradients mimicking in vivo tissue variation regulate mesenchymal stem cell fate

Justin R Tse et al. PLoS One. .

Abstract

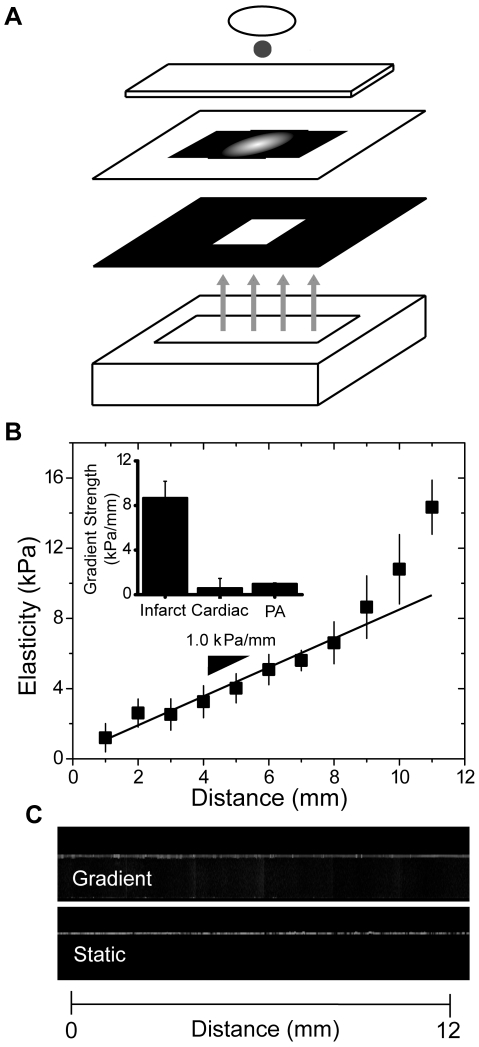
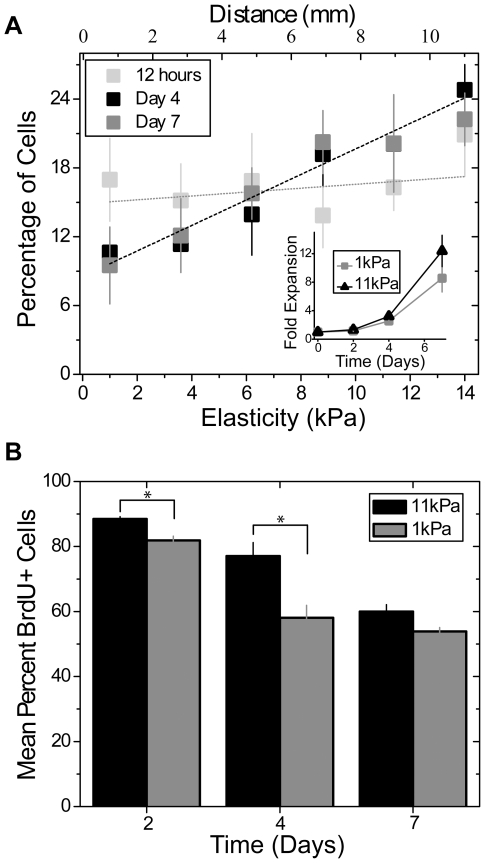
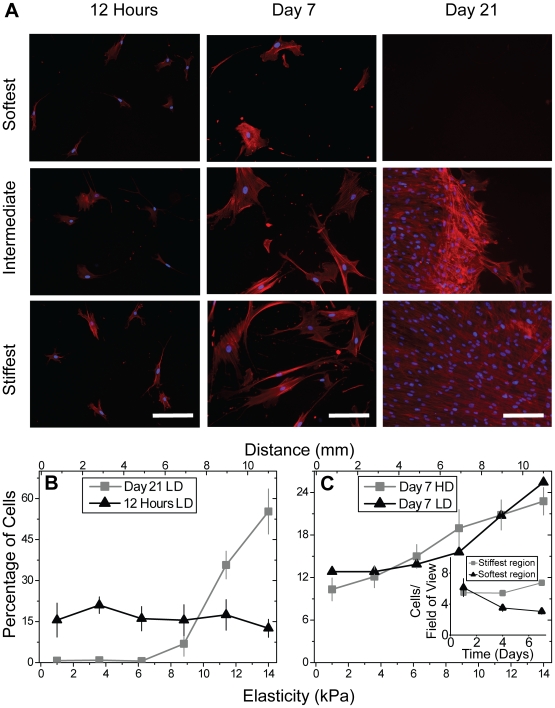
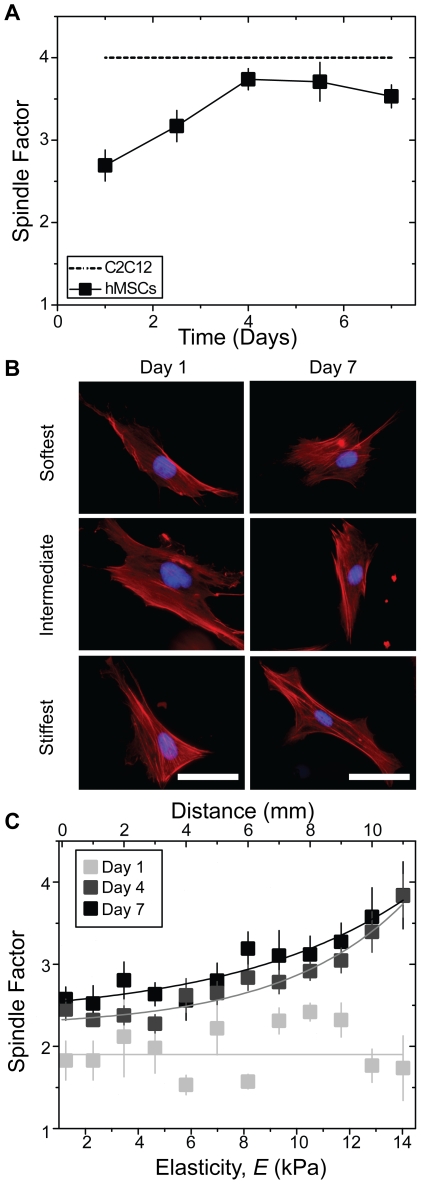
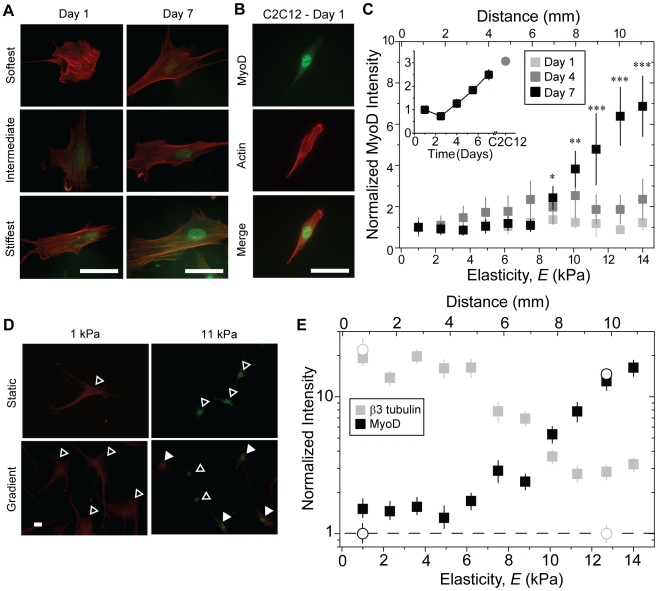
Mesenchymal stem cell (MSC) differentiation is regulated in part by tissue stiffness, yet MSCs can often encounter stiffness gradients within tissues caused by pathological, e.g., myocardial infarction ∼8.7±1.5 kPa/mm, or normal tissue variation, e.g., myocardium ∼0.6±0.9 kPa/mm; since migration predominantly occurs through physiological rather than pathological gradients, it is not clear whether MSC differentiate or migrate first. MSCs cultured up to 21 days on a hydrogel containing a physiological gradient of 1.0±0.1 kPa/mm undergo directed migration, or durotaxis, up stiffness gradients rather than remain stationary. Temporal assessment of morphology and differentiation markers indicates that MSCs migrate to stiffer matrix and then differentiate into a more contractile myogenic phenotype. In those cells migrating from soft to stiff regions however, phenotype is not completely determined by the stiff hydrogel as some cells retain expression of a neural marker. These data may indicate that stiffness variation, not just stiffness alone, can be an important regulator of MSC behavior.


Conflict of interest statement

Competing Interests: The authors have declared that no competing interests exist.

Figures

Figure 1
Figure 1. Hydrogel fabrication and characterization.
(a) The schematic shows (from top to bottom) the 25 mm diameter aminosilanated glass coverslip, the acrylamide/bis-acrylamide solution with dissolved photoinitiator, a chlorosilanated glass slide, patterned photomask, negative photomask, and 254 nm UV light source. (b) AFM-determined elasticity of PA hydrogels was measured by every 1 mm from the center to the edge of the circular hydrogel. The gradient spans 10-fold change in elasticity from 1 to 14 kPa with a gradient strength of 0.96±0.12 kPa/mm. The inset shows a comparison of gradient strength of the hydrogel to those found in infarcted rat myocardium and the natural variations in adjacent, unaffected myocardium . (c) Confocal microscopy images of collagen functionalized PA gradient (top) and static (bottom) hydrogels show collagen localized to the top surface of the hydrogels with roughly uniform distribution regardless of spatial changes in elasticity.
Figure 2
Figure 2. Migration and proliferation of MSCs on hydrogels.
(a) At 12 hours, cell density is approximately uniform regardless of substrate stiffness (gray; p = 0.76 between data points). There was a loss and accumulation of MSCs on the softest and stiffest regions of the hydrogel, respectively, after both 4 and 7 days (p<0.005 and 0.05, respectively, using a one-way ANOVA comparison of slopes). The inset plot shows a noticeable proliferative difference in MSCs cultured on static hydrogels of 1 and 11 kPa. (b) BrdU staining of MSCs cultured on 1 or 11 kPa static hydrogels demonstrates that proliferation rate decreases as time increases for both stiffness values though MSCs on 11 kPa hydrogels proliferate at a slightly faster rate. *p<0.05 using student t-tests.
Figure 3
Figure 3. Spatial distribution of mitomycin C-treated MSCs on gradient hydrogels.
(a) Images of Hoescht 33342 (blue) and phalloidin (red)-stained mitomycin C-treated MSCs plated at low density (250 cells/cm2) illustrate the change in distribution with time. After 21 days, MSCs are locally confluent in the stiffest region of the hydrogel. Scale bar is 56.5 µm. (b) At 12 hours, low density mitomycin C-treated cells were distributed evenly, while at day 21, essentially all the cells had migrated to the stiffest region of the hydrogel and formed a locally confluent layer. p<0.001 for all data comparing days 1 and 21. (c) At day 7, both low density and high (1000 cells/cm2) density cell seeding shows a 2-fold increase in cell density between the stiffest and softest regions of the hydrogel. The inset shows how the cell density changes at the stiffest versus the softest region over time. p<10−2 for both densities comparing cells at the center and edge.
Figure 4
Figure 4. Morphological changes of MSCs as a function of time on gradient hydrogels.
(a) MSCs cultured on static 11 kPa hydrogels increase their spindle factor whereas C2C12 myoblasts remain spindle-shaped throughout culture time as shown in . (b) Morphological changes in cells stained with Hoescht 33342 (blue) and phalloidin (red) can be observed as a function of culture time and stiffness in MSCs cultured on gradient hydrogels. Scale bar is 12.5 µm. (c) Quantification of the spindle factor, i.e. the major divided minor axes, from images in (b) shows no relationship to stiffness at day 1, but by 4 and 7 days in culture, spindle factor increases from about 2.5 to 4 as a function of gradient stiffness.
Figure 5
Figure 5. MSC expression of lineage markers as a function of time on gradient hydrogels.
(a) Immunofluorescent staining for MyoD (green) and phalloidin (red) observed as a function of culture time and stiffness in MSCs cultured on gradient hydrogels. (b) Quantification of MSC nuclear immunofluorescent intensity over time and gradient position. Intensity was normalized to MSCs at the coverslip edge and shown as a fold change. Inset plot shows quantification of MSC nuclear immunofluorescent intensity (black squares) for cells cultured on static 11 kPa hydrogels over time. Nuclear immunofluorescent intensity of C2C12 myoblasts (gray circle) cultured for 1 day on static 11 kPa hydrogels is also shown. Intensity for all cells was normalized to MSCs at day 1. *p<10−2, ** p<10−3, *** p<10−4 compared to both days 1 and 4. (c) Immunofluorescent staining for MyoD (green) and phalloidin (red) in a C2C12 myoblast cultured for 1 day on a static 11 kPa hydrogel. (d) MSCs were cultured on 1 and 11 kPa static (top) and gradient (bottom) hydrogels and stained for β3 tubulin (red) and MyoD (green). Open arrowheads indicate cells expressing either β3 tubulin or MyoD while filled arrowheads indicate doubly stained cells. (e) MSC fluorescent intensity on gradient hydrogels (filled squares) was quantified for β3 tubulin (grey) and MyoD (black) and normalized to the non-permissive static hydrogel (open circles), i.e. β3 tubulin and MyoD intensities were normalized to MSC intensity on static 11 and 1 kPa hydrogels, respectively. The dashed line indicates no change from the non-permissive hydrogel of that protein. All scale bars are 12.5 µm.

References

    1. Hynes RO. The extracellular matrix: not just pretty fibrils. Science. 2009;326:1216–1219. - PMC - PubMed
    1. Badylak SF. Regenerative medicine and developmental biology: the role of the extracellular matrix. Anat Rec B New Anat. 2005;287:36–41. - PubMed
    1. Hay ED. New York: Plenum Press; 1991. Cell biology of extracellular matrix.468
    1. Discher DE, Janmey P, Wang YL. Tissue cells feel and respond to the stiffness of their substrate. Science. 2005;310:1139–1143. - PubMed
    1. Pelham RJ, Jr, Wang Y. Cell locomotion and focal adhesions are regulated by substrate flexibility. Proc Natl Acad Sci U S A. 1997;94:13661–13665. - PMC - PubMed

Publication types