. 2011 Jan 5;6(1):e15816.
doi: 10.1371/journal.pone.0015816.

Docosahexaenoic acid-derived neuroprotectin D1 induces neuronal survival via secretase- and PPARγ-mediated mechanisms in Alzheimer's disease models

Affiliations

Docosahexaenoic acid-derived neuroprotectin D1 induces neuronal survival via secretase- and PPARγ-mediated mechanisms in Alzheimer's disease models

Yuhai Zhao et al. PLoS One. .

Abstract

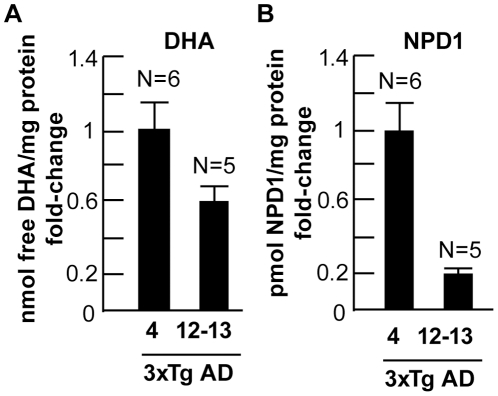
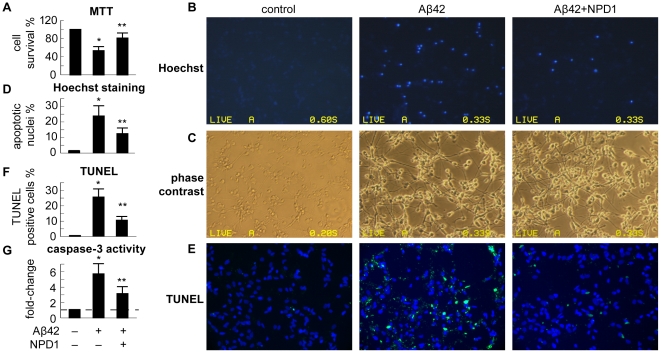
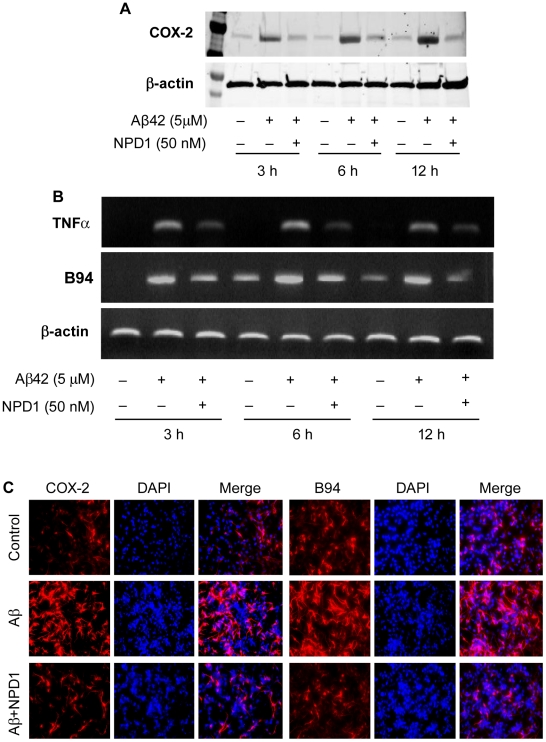
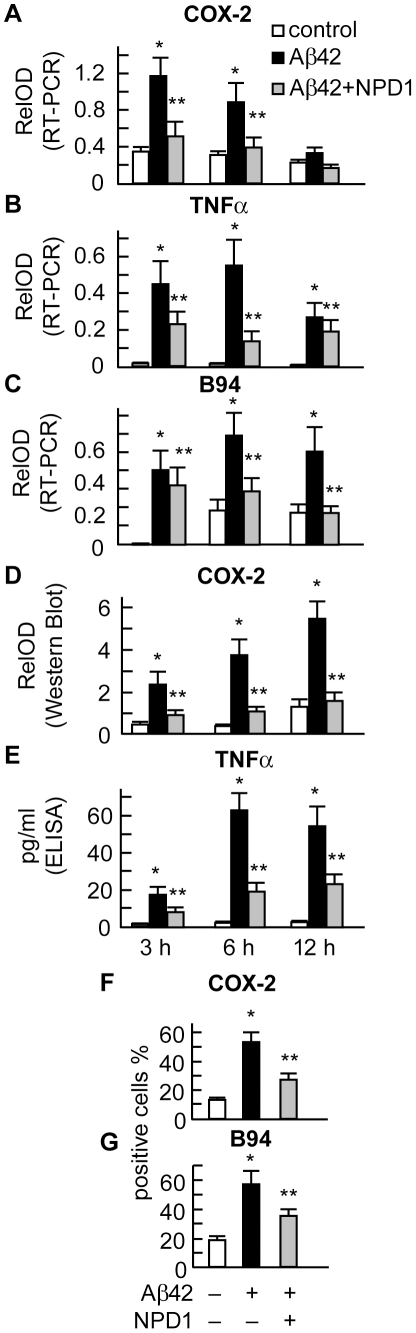
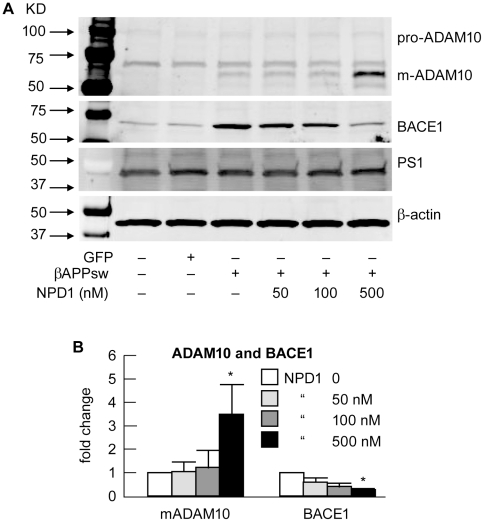
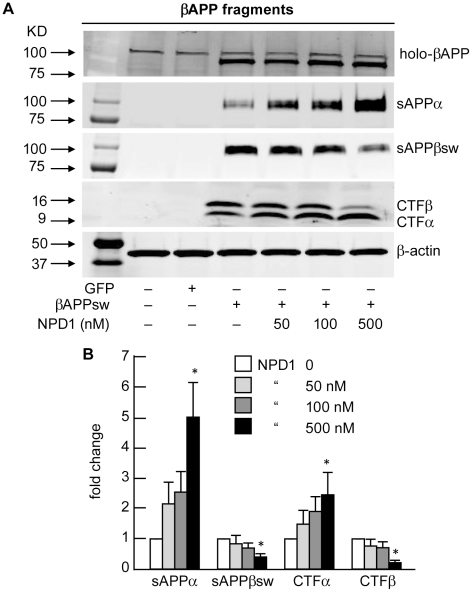
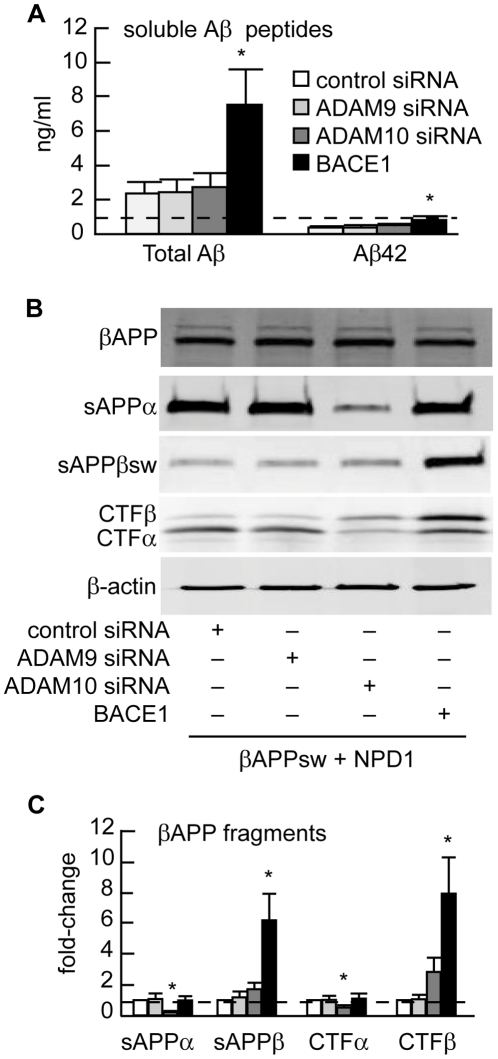
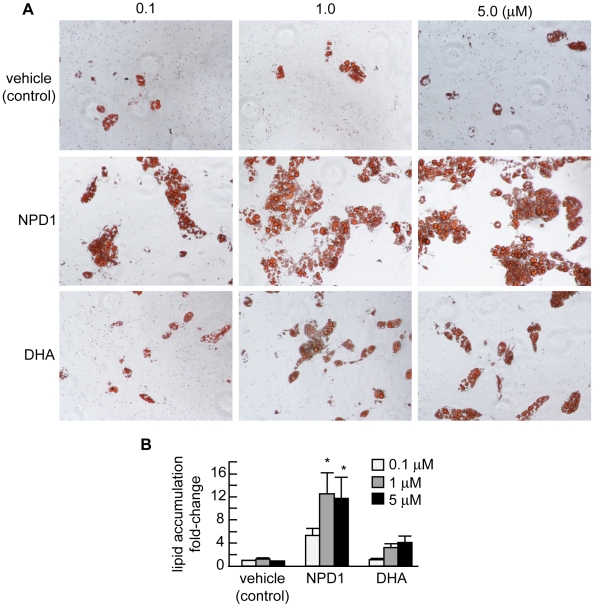
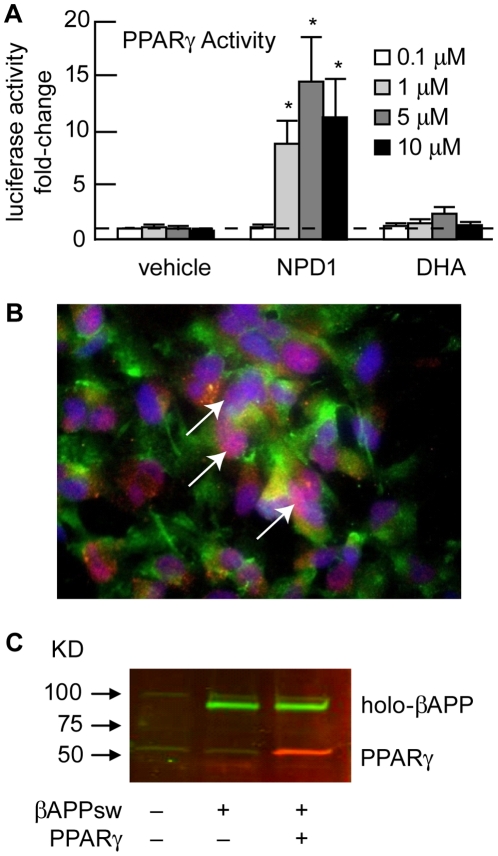
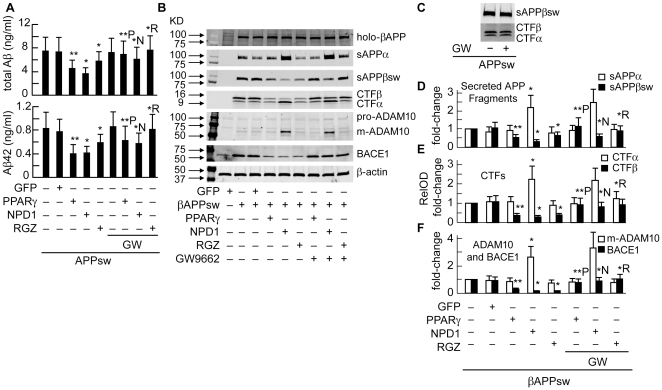
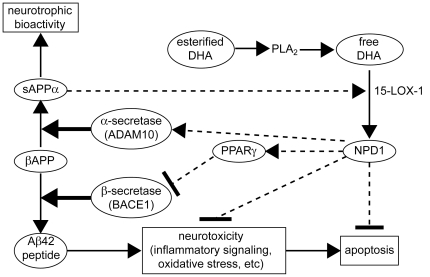
Neuroprotectin D1 (NPD1) is a stereoselective mediator derived from the omega-3 essential fatty acid docosahexaenoic acid (DHA) with potent inflammatory resolving and neuroprotective bioactivity. NPD1 reduces Aβ42 peptide release from aging human brain cells and is severely depleted in Alzheimer's disease (AD) brain. Here we further characterize the mechanism of NPD1's neurogenic actions using 3xTg-AD mouse models and human neuronal-glial (HNG) cells in primary culture, either challenged with Aβ42 oligomeric peptide, or transfected with beta amyloid precursor protein (βAPP)(sw) (Swedish double mutation APP695(sw), K595N-M596L). We also show that NPD1 downregulates Aβ42-triggered expression of the pro-inflammatory enzyme cyclooxygenase-2 (COX-2) and of B-94 (a TNF-α-inducible pro-inflammatory element) and apoptosis in HNG cells. Moreover, NPD1 suppresses Aβ42 peptide shedding by down-regulating β-secretase-1 (BACE1) while activating the α-secretase ADAM10 and up-regulating sAPPα, thus shifting the cleavage of βAPP holoenzyme from an amyloidogenic into the non-amyloidogenic pathway. Use of the thiazolidinedione peroxisome proliferator-activated receptor gamma (PPARγ) agonist rosiglitazone, the irreversible PPARγ antagonist GW9662, and overexpressing PPARγ suggests that the NPD1-mediated down-regulation of BACE1 and Aβ42 peptide release is PPARγ-dependent. In conclusion, NPD1 bioactivity potently down regulates inflammatory signaling, amyloidogenic APP cleavage and apoptosis, underscoring the potential of this lipid mediator to rescue human brain cells in early stages of neurodegenerations.


Conflict of interest statement

Competing Interests: The authors have declared that no competing interests exist.

Figures

Figure 1
Figure 1. DHA and NPD1 analysis in 3xTg-AD hippocampus.
DHA and NPD1 levels were analyzed using liquid chromatography-photodiode array-electrospray ionization-tandem mass spectrometry (LC-PDA-ESI-MS-MS) . 3xTg-AD mouse brain hippocampus was sampled at 4 and 12–13 months and were compared to age-matched controls. DHA levels were reduced to 0.61-fold of control between 12–13 and 4 month old 3xTg AD mice (A); similarly NPD1 levels were reduced to 0.22-fold of control in 12–13 month old 3xTg-AD mice compared to 4 month 3xTg-AD mice (B). *p<0.05; ** p<0.01 (ANOVA).
Figure 2
Figure 2. NPD1 promotes cell survival in Aβ42 oligomer stressed-human HNG cells in primary culture.
HNG cells were treated for 48 h with 5 µM of Aβ42 oligomer in the absence or presence of NPD1 (50 nM). (A) NPD1 promotes HNG cell survival in response to Aβ42 neurotoxicity as shown by MTT cell viability assay following reduction of the tetrazolium salt MTT (Sigma-Aldrich). Results, expressed as the percentage of cell survival, are the means ± SEM of three experiments performed in triplicate. Untreated cells were 100% viable. Panels (B-G) depict anti-apoptotic effect of NPD1 by combining Hoechst 33258 staining, phase contrast microscopy, TUNEL assay and caspase-3 activity assay. (B) Upper panel illustrates the appearance of Hoechst 33258 positive cells upon different treatments (20× magnification); (C) middle panel shows phase-contrast images of corresponding HNG cells. (D) Number of Hoechst 33258-positive apoptotic nuclei per 100 of total cells (n = 5). (E) TUNEL (green fluorescence) assay and (DAPI) (blue) staining (20× magnification) of HNG cells. (F) Percentage of TUNEL-positive cellular nuclei in each treatment group (n = 5). (G) Caspase-3 activity of HNG cells after Aβ42 peptide and NPD1 treatment; dashed horizontal line at 1.0 indicates control caspase-3 activity for ease of comparison; (n = 3). Data are expressed as means ± SEM. *p<0.01 vs. control; **p<0.01 vs. Aβ42 peptide.
Figure 3
Figure 3. NPD1 down-regulates the expression of the pro-inflammatory genes COX-2, TNFα and B94, compared to β-actin levels in the same sample, in response to Aβ42 oligomer (5 µM); rescue by NPD1 (50 nM).
(A) COX-2 and β-actin mRNA expression was detected by RT-PCR followed by agarose gel electrophoresis. (B) Western blot detection of TNFα, B94 and β-actin expression in control or Aβ42 peptide-stressed HNG cells at 3, 6 and 12 h in the presence or absence of NPD1. (C) Immuno-fluorescent staining of COX-2 or B94 (red). Nuclei were visualized using DAPI (blue) (20× magnification). Quantitative analysis of COX-2 and B94 gene expression (n = 3 to 5; see Figure 5 ).
Figure 4
Figure 4. NPD1 down-regulates Aβ42-induced expression of pro-inflammatory genes COX-2, TNFα and B94 at both the mRNA (RT-PCR) and protein (Western blot or ELISA) level.
HNG cells were incubated with 5 µM of Aβ42 oligomer in the absence or presence of NPD1 (50 nM) for 3, 6 and 12 h. NPD1 suppressed Aβ42 peptide-induced mRNA expression of COX-2, TNFα and B94. (A–C) mRNA expression was detected by RT-PCR followed by agarose gel electrophoresis (see Figure 4); (D,E) NPD1 reduced COX-2 and TNFα protein abundance in response to Aβ42 stress; (E) Time course of TNFα secretion as detected by ELISA (n = 3); (F,G) NPD1 reduced the number of COX-2 and B94 positive cells after Aβ42 peptide-induced stress. In F and G HNG cells were incubated for 24 h under the indicated treatments. Results are means ± SEM. *p<0.01 vs. control; **p<0.01 vs. Aβ42 peptide-treated.
Figure 5
Figure 5. HNG cells transfected with βAPPsw and treated with NPD1 - effects on precursor α-secretase (pro-ADAM10), mature ADAM10 (m-ADAM10), β-secretase (BACE1) and γ-secretase (PS1).
(A) Control or HNG cells over-expressing βAPPsw were incubated with increasing doses (0, 50, 100 and 500 nM, respectively) of NPD1 before cell lysates were harvested and subjected to Western blotting for the precursor of ADAM10 (pro-ADAM10), mature ADAM10 (m-ADAM10), BACE1 and PS1 using the levels of β-actin as a control in the same sample; (B) Quantitation of gel bands in (A); NPD1 activates m-ADAM10 while inhibiting BACE1 expression; quantification of m-ADAM10 and BACE1 expression by Western blotting analysis after normalization to β-actin; results are means ± SEM (n = 3); *p<0.01 vs. βAPPsw control.
Figure 6
Figure 6. NPD1 shifts βAPP processing from the amyloidogenic to the non-amyloidogenic pathway.
(A) Control or HNG cells over-expressing βAPPsw were treated with increasing concentrations (0, 50, 100, 500 nM) of NPD1 for 48 h and subjected to Western blot detection of holo-βAPP (βAPP holoenzyme), sAPPα, sAPPβsw, CTFα and CTFβ in comparison to β-actin levels in the same sample; (B) Quantification of gel bands in (A) analyzing βAPP fragments with increasing doses of NPD1. Results are means ± SEM (n = 4); *p<0.01 vs. βAPPsw control.
Figure 7
Figure 7. BACE1 and ADAM10 are required in NPD1-regulated βAPP processing into the release of soluble Aβ peptides and Aβ42 peptides (ng/ml cell culture medium).
(A) Effects of control siRNA, ADAM9 siRNA or ADAM10 siRNA on shedding of total Aβ peptides or Aβ42 peptides into the HNG cell growth medium. (B) HNG cells over-expressing βAPPsw were co-transfected with control siRNA or siRNA specifically targeting ADAM9 or ADAM10, or with BACE1 plasmid DNA for 48 h in the presence of 500 nM of NPD1. (C) Quantification of gel bands in (B) analyzing βAPP fragments with increasing doses of NPD1. Results are means ± SEM (N = 4); *p<0.01 vs. βAPPsw control. Effects of different treatments are measured by ELISA for total Aβ peptides or Aβ42 peptides (n = 5), or by Western blotting (n = 3); * p<0.01 vs. βAPPsw control.
Figure 8
Figure 8. Human pre-adipocytes were cultured according to the manufacturer's instructions (Zen-Bio, Research Triangle Park, NC) (A).
Upon initiation of the differentiation assay, pre-adipocytes were incubated in adipocyte medium supplemented with vehicle (control), NPD1 or DHA (see Materials and Methods). Results quantified in bar graph format indicate significant up-regulation of lipid accumulation in NPD1-treated, in contrast to DHA-treated, human pre-adipocyte cells (B).
Figure 9
Figure 9. NPD1 activates PPARγ.
(A) PPARγ activities upon incubation with NPD1 or DHA are shown in bar graph format. The activation of PPARγ by NPD1 and DHA was assessed using a cell-based luciferase reporter transactivation assay after incubation with increasing concentrations (0.1, 1.0, 5.0 and 10.0 µM) of NPD1 or DHA for 24 h. Luciferase activity was normalized to β-gal activity (transfection efficiency control) and results were expressed as fold-change of induction relative to vehicle treated HNG cells (n = 4). Horizontal dashed line at 1.0 indicates control PPARγ levels at 1 µM for ease of comparison; *p<0.01 vs. corresponding vehicle controls. (B) Co-transfection of βAPPsw and PPARγ in HNG cells; immunofluorescence detection of βAPPsw (green; λ = 530 nm) and PPARγ (red; λ = 670 nm) in HNG cells over-expressing both proteins; HNG nuclei are stained with DAPI (blue; λ = 470 nm); overlap of PPARγ and HNG cell nuclear signal (violet; λ = 420 nm; arrows) indicates nuclear association of PPARγ; 40x magnification. (C) Two-color Western blot with Odyssey infrared imaging showing over-expression of both βAPPsw (green) and PPARγ (red) in whole HNG cell extracts.
Figure 10
Figure 10. PPARγ activation is required for anti-amyloidogenic effect of NPD1 but not for activation of ADAM10.
HNG cells over-expressing βAPPsw were co-transfected with 2.0 µg of pEGFP or PPARγ cDNA or incubated with 0.5 µM of NPD1 or rosiglitazone (RGZ) in the absence or presence of 2 µM of GW9662 for 48 h before being harvested for assay. (A) ELISA assay of total Aβ and Aβ42 peptides (ng/ml) from conditioned media of HNG cells with different treatments; (B) Western blot analysis of βAPP fragments as well as ADAM10 and BACE1 from HNG cells under different conditions as indicated in the lower part of panel (B) in these Western images; (C) Western analysis of sAPPβsw or CTFs from HNG cells over-expressing βAPPsw in the absence or presence of 2 µM of GW9662; (D–F) Quantification of βAPP fragments, ADAM10 and BACE1 levels based on Western results (n = 3). *p<0.01 vs. βAPPsw control; **p<0.01 vs βAPPsw + pEGFP co-transfection; *N p<0.01 vs. βAPPsw + NPD1; *R p<0.01 vs. βAPPsw + rosiglitazone; **p<0.01 vs. βAPPsw + PPARγ co-transfection.
Figure 11
Figure 11. NPD1 promotes non-amyloidogenic, neurotrophic bioactivity via pleiotrophic mechanisms.
Membrane esterified DHA is excised by phospholipase A2 (PLA2) to yield free DHA; in turn free DHA is 15-lipoxygenated to generate NPD1 which then enters a neuroprotective cycle. These events are mediated, in part, by inhibiting apoptosis, by blocking inflammatory signaling, by promoting cell survival and by shifting βAPP processing from an amyloidogenic into a neurotrophic, non-amyloidogenic pathway. BACE1 activity is suppressed and α-secretase (ADAM10) activity is stimulated, thus down-regulating Aβ42 peptide release from membranes. Augmentation of BACE1 and ADAM10 by NPD1 may be mediated via other neuromolecular factors. We note that the ADAM10 cleavage product sAPPα further induces the conversion of free DHA into NPD1, thus constituting a positive, neurotrophic feedback loop.

Similar articles

Cited by

References

    1. Haass C, Selkoe DJ. Soluble protein oligomers in neurodegeneration: lessons from the Alzheimer's amyloid beta-peptide. Nat Rev Mol Cell Biol. 2007;8:101–112. - PubMed
    1. Golde TE, Dickson D, Hutton M. Filling the gaps in the abeta cascade hypothesis of Alzheimer's disease. Curr Alzheimer Res. 2006;3:421–430. - PubMed
    1. Bertram L, Lill CM, Tanzi RE. The genetics of Alzheimer disease: back to the future. Neuron. 2010;68:270–281. - PubMed
    1. Goedert M, Clavaguera F, Tolnay M. The propagation of prion-like protein inclusions in neurodegenerative diseases. Trends Neurosci. 2010;33:317–325. - PubMed
    1. Haass C. Initiation and propagation of neurodegeneration. Nat Med. 2010;16:1201–1204. - PubMed

Publication types

MeSH terms