. 2011 Mar;108(3):666-75.
doi: 10.1002/bit.22966. Epub 2010 Dec 1.

Characterization of combinatorial patterns generated by multiple two-component sensors in E. coli that respond to many stimuli

Affiliations

Characterization of combinatorial patterns generated by multiple two-component sensors in E. coli that respond to many stimuli

Elizabeth J Clarke et al. Biotechnol Bioeng. 2011 Mar.

Abstract

Two-component systems enable bacteria to sense changes in their environment and adjust gene expression in response. Multiple two-component systems could function as a combinatorial sensor to discriminate environmental conditions. A combinatorial sensor is composed of a set of sensors that are non-specifically activated to different magnitudes by many stimuli, such that their collective activity pattern defines the signal. Using promoter reporters and flow cytometry, we measured the response of three two-component systems in Escherichia coli that have been previously reported to respond to many environmental stimuli (EnvZ/OmpR, CpxA/CpxR, and RcsC/RcsD/RcsB). A chemical library was screened for the ability to activate the sensors and 13 inducers were identified that produce different patterns of sensor activity. The activities of the three systems are uncorrelated with each other and the osmolarity of the inducing media. Five of the seven possible non-trivial patterns generated by three sensors are observed. This data demonstrate one mechanism by which bacteria are able to use a limited set of sensors to identify a diverse set of compounds and environmental conditions.


Figures

Figure 1
Figure 1
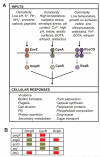
The three two-component systems used in this study are shown. A: Each sensor responds to many stimuli and different combinations of the response regulators affect a variety of cellular processes. B: One mechanism to respond to a pattern is through the arrangement of multiple binding sites in a promoter. Several examples of promoters are shown where footprinting data is available and the response regulator either activates (green), represses (red) or has a biphasic (red/green) affect on expression. Details, including references used to generate these figures, are included in the Supplemental Information.
Figure 2
Figure 2
The plasmid-based transcriptional reporters are shown. A: An example of the time course is shown for the pAC-Rcs reporter plasmid when uninduced (grey) and induced by 550 mM NaCl (black). The cytometry distributions are shown for induced and uninduced cells at the end of the time course. B: The dependence of each promoter on its cognate response regulator was determined by measuring its induction in a knockout strain. The controls were performed with a strong inducer of each system: (left) pompC, 3 mM indole; (center) pcpxP, 0.2% phenethyl alcohol; (right) prprA, 550 mM NaCl. Error bars are the standard deviation from the mean of two experiments performed on different days.
Figure 3
Figure 3
The measurement of properties required for participation in a combinatorial sensor. A: Chemically-distinct compounds and shifts in pH induce all three systems, but to varying degrees. Each graph shows the fold-induction of the chemicals and pH changes in rank order for each sensor. B: The activities of the sensors are independent from each other. The correlation coefficients for each pair of sensors were calculated (pcpxP-pompC, R2 = 0.323; prprA-pompC, R2 = 0.024; prprA-pcpxP, R2 = 0.001). The data is the average of two or experiments performed on different days, and error bars are the standard deviation from the mean. C: The sensor activities do not correlate with the osmolarity of the media and chemicals.
Figure 4
Figure 4
Time courses are shown for chemicals that are characteristic of the five observed patterns. Patterns are shown for 550 mM NaCl, 0.3% pentanol, 0.54% butanol, 3 mM indole, and pH 5 (the entire data set is shown in Fig. S2). The corresponding pattern is shown on the right, where the height of each bar is equal to the maximum induction measured over the 2-h time course. Points are the average of two or more experiments performed on different days, and error bars are the standard deviation from the mean. For the pH 5 condition, the response of pcpxP is less than one, which is demarcated by a star. The colors of the bars correspond to the clusters in Figure 5.
Figure 5
Figure 5
A PCA is used to cluster the sensor activity patterns produced by each chemical. A: Each point corresponds to the pattern generated by a single chemical projected onto a two-dimensional principal component space. The points are clustered by the pattern produced (ovals). The colors of the clusters correspond with the patterns in Figure 4. The pattern corresponding to no induction for all three systems is represented on the graph as a black dot. Note that the value of the principal components is not a measure of the magnitude of induction. B: The effect of chemical concentration on the patterns is shown. A trajectory crossing the boundary of a cluster signifies that the pattern has changed. The patterns for the alcohols are insensitive to changes in concentration, whereas the pattern for pH changes dramatically. The concentrations of chemicals in the trajectories are (top to bottom): pentanol (0.16, 0.2, 0.24, 0.28, 0.32%), butanol (0.5, 0.6, 0.7, 0.8%), and ethanol (1.6, 2.0, 2.4, 2.8, 3.2%). The pH values are (top to bottom) 4, 5, 6, 7, 8, 9, and 10.

Similar articles

Cited by

References

    1. Ache BW, Young JM. Olfaction: Diverse species, conserved principles. Neuron. 2005;48(3):417–430. - PubMed
    1. Aiba H, Mizuno T, Mizushima S. Transfer of phosphoryl group between two regulatory proteins involved in osmoregulatory expression of the ompF and ompC genes in Escherichia coli. J Biol Chem. 1989;264(15):8563–8567. - PubMed
    1. Alphen WV, Lugtenberg B. Influence of osmolarity of the growth medium on the outer membrane protein pattern of Escherichia coli. J Bacteriol. 1977;131(2):623–630. - PMC - PubMed
    1. Anderson JC, Clarke EJ, Arkin AP, Voigt CA. Environmentally controlled invasion of cancer cells by engineered bacteria. J Mol Biol. 2006;355(4):619–627. - PubMed
    1. Arricau N, Hermant D, Waxin H, Ecobichon C, Duffey PS, Popoff MY. The RcsB–RcsC regulatory system of Salmonella typhi differentially modulates the expression of invasion proteins, flagellin and Vi antigen in response to osmolarity. Mol Microbiol. 2002;29:835–850. - PubMed

Publication types

LinkOut - more resources