. 2011 Mar 1;519(4):599-620.
doi: 10.1002/cne.22516.

Early microglia activation in a mouse model of chronic glaucoma

Affiliations

Early microglia activation in a mouse model of chronic glaucoma

Alejandra Bosco et al. J Comp Neurol. .

Abstract

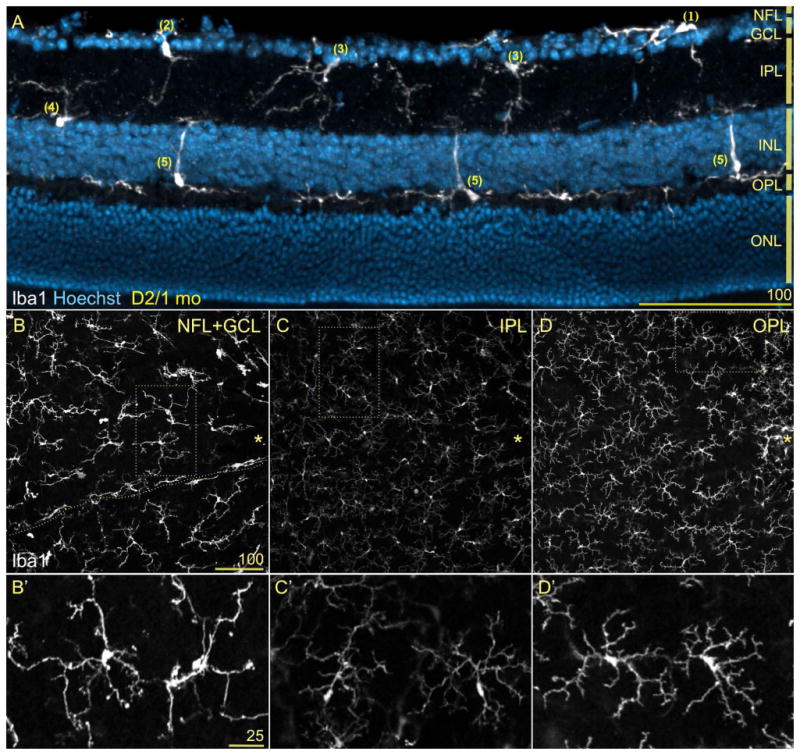
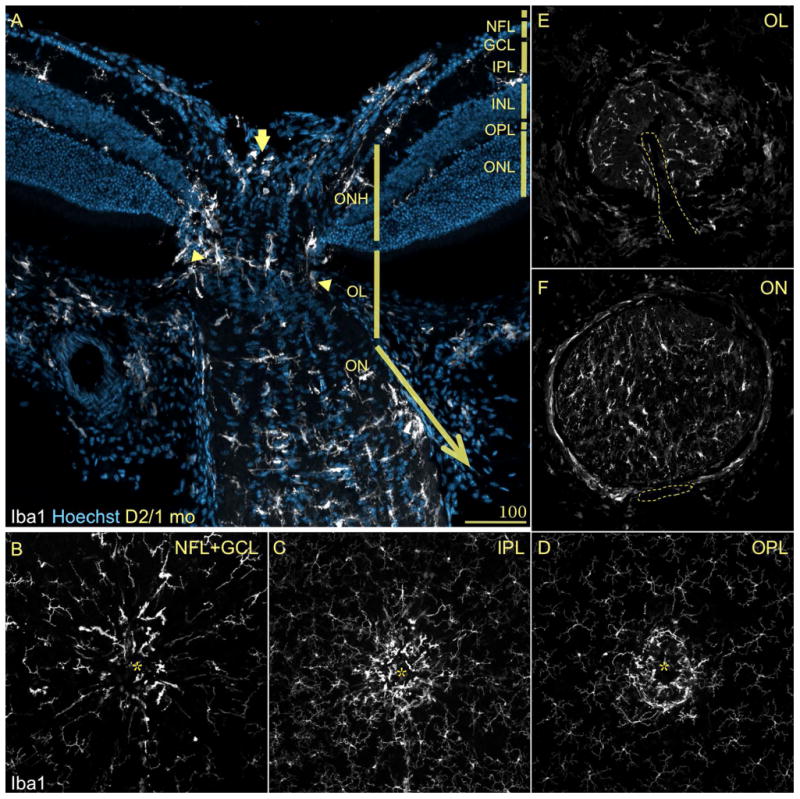
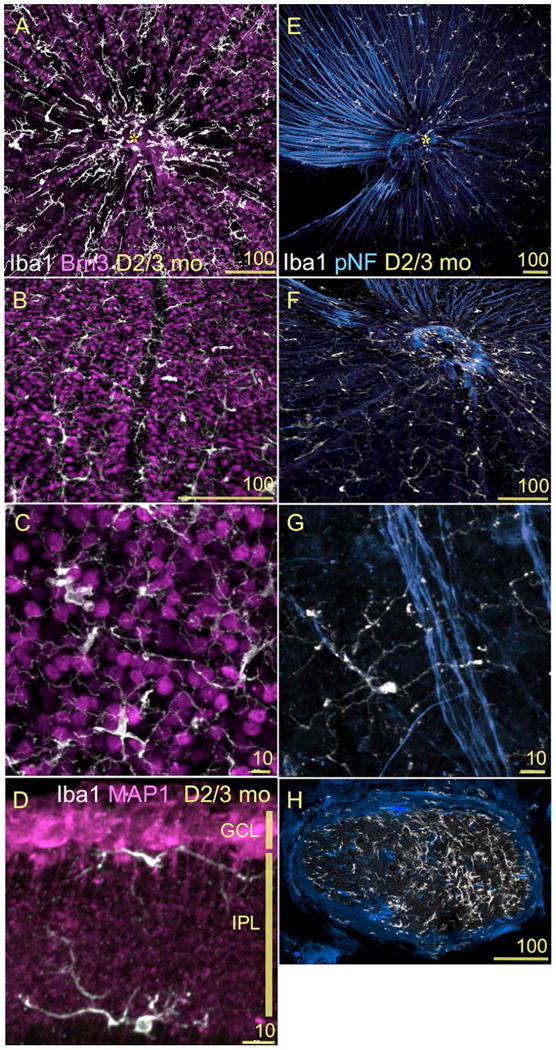
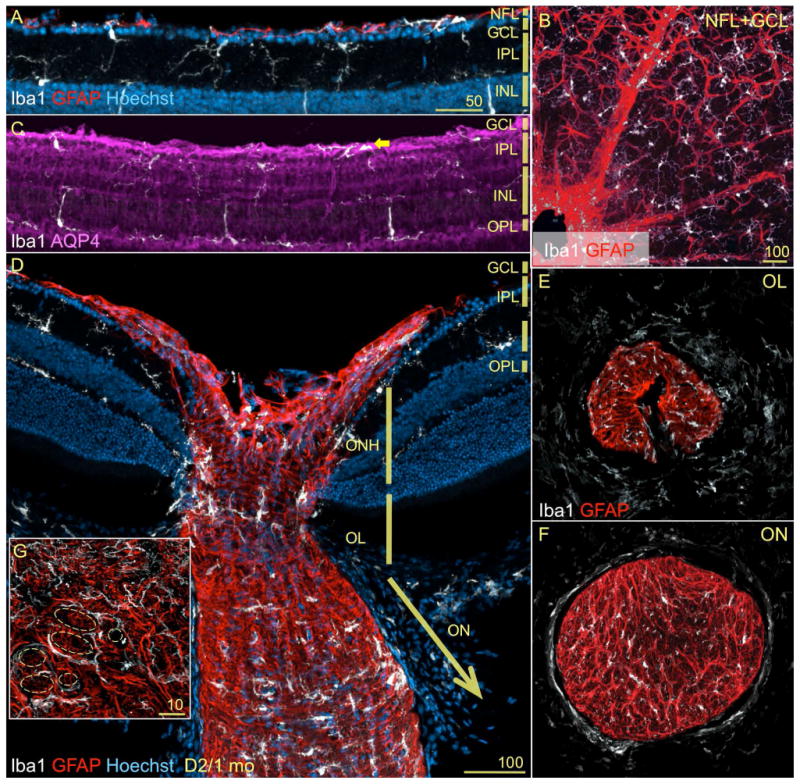
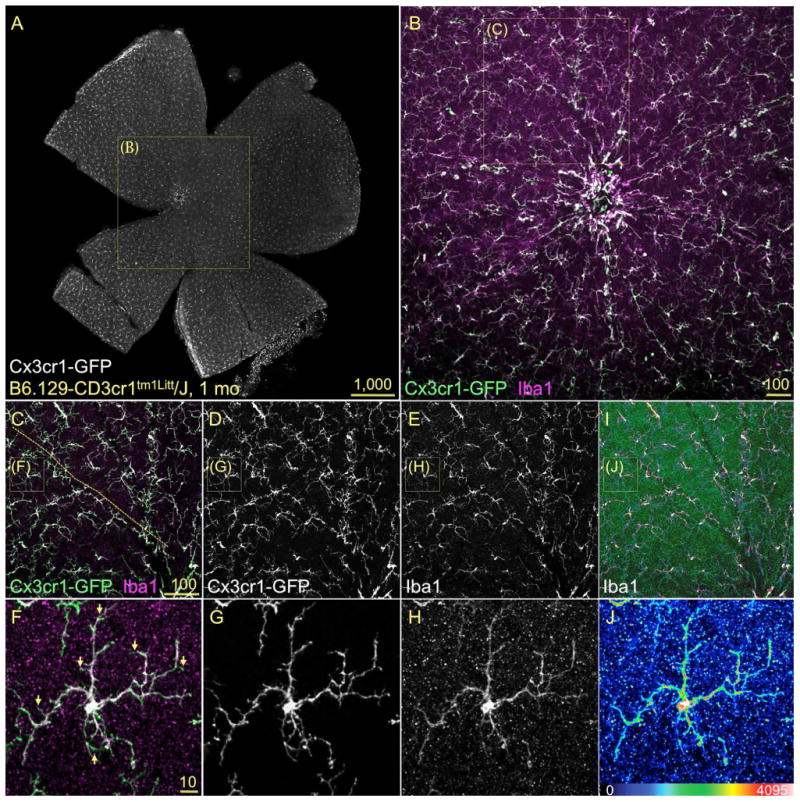
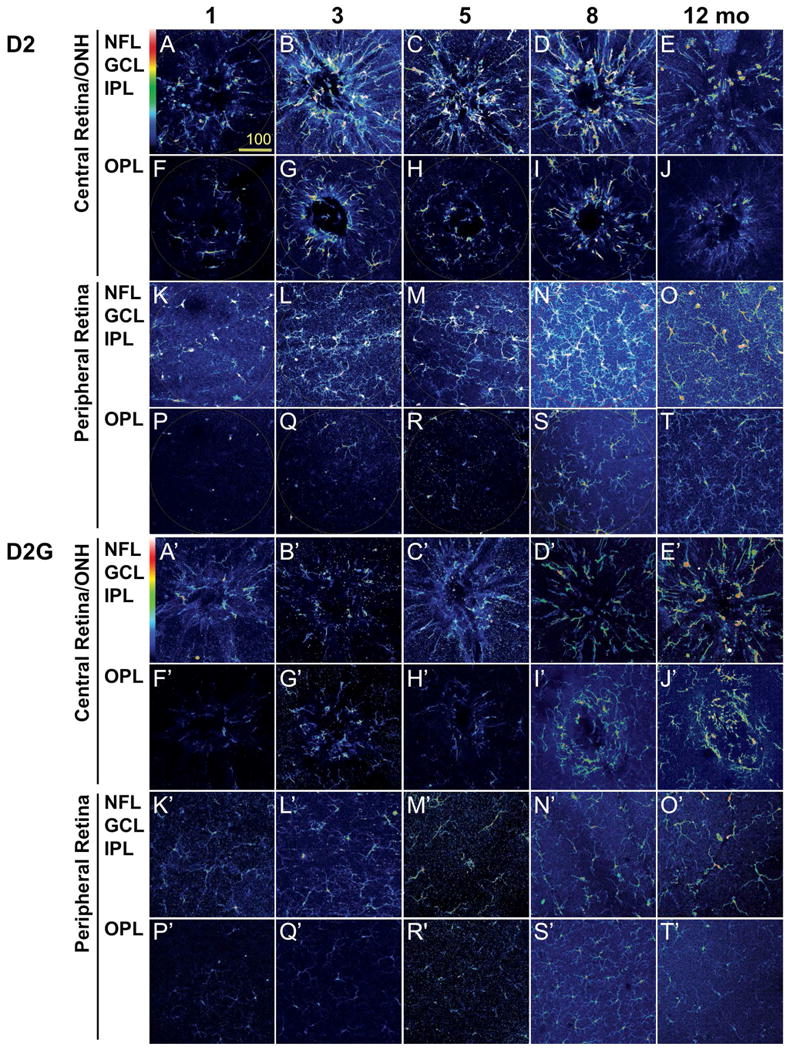
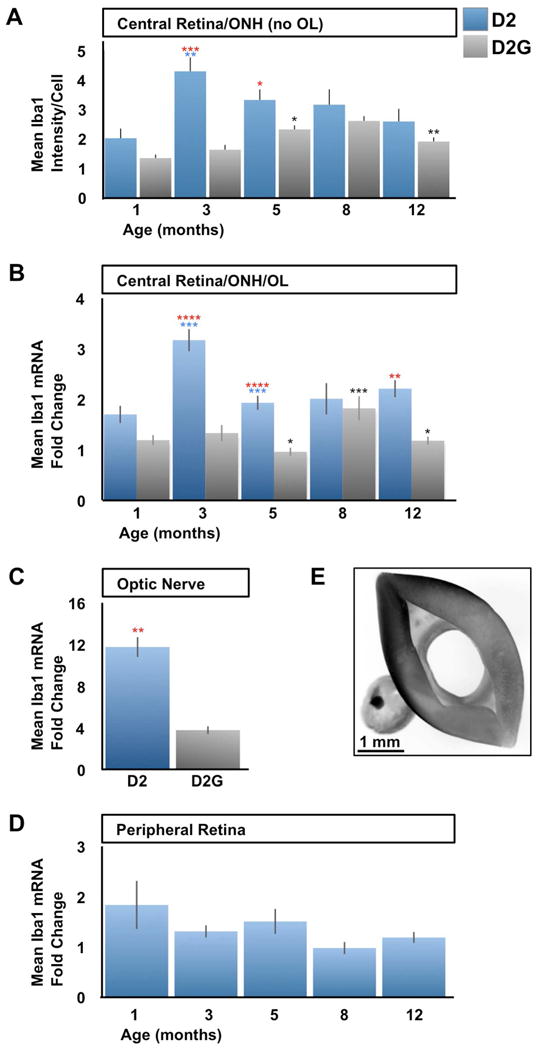
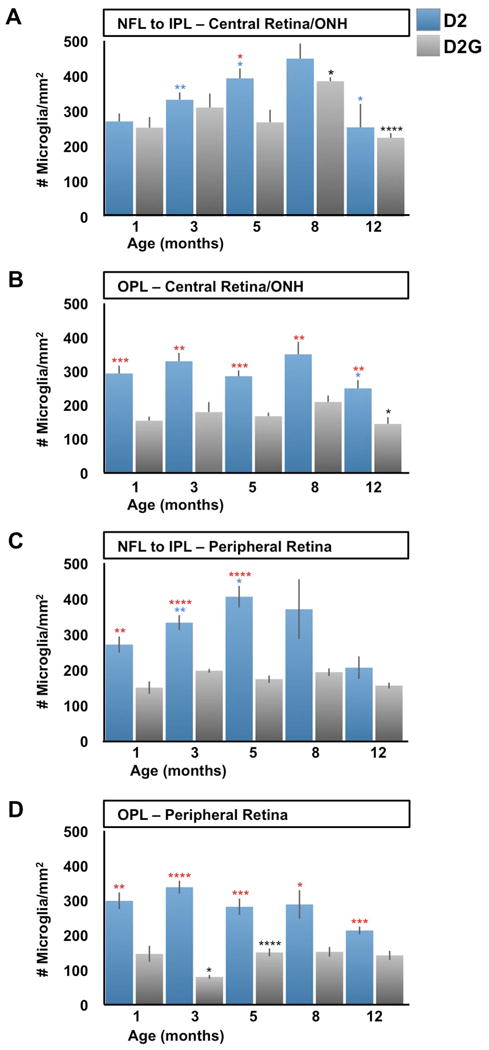
Changes in microglial cell activation and distribution are associated with neuronal decline in the central nervous system (CNS), particularly under pathological conditions. Activated microglia converge on the initial site of axonal degeneration in human glaucoma, yet their part in its pathophysiology remains unresolved. To begin with, it is unknown whether microglia activation precedes or is a late consequence of retinal ganglion cell (RGC) neurodegeneration. Here we address this critical element in DBA/2J (D2) mice, an established model of chronic inherited glaucoma, using as a control the congenic substrain DBA/2J Gpnmb(+/SjJ) (D2G), which is not affected by glaucoma. We analyzed the spatial distribution and timecourse of microglial changes in the retina, as well as within the proximal optic nerve prior to and throughout ages when neurodegeneration has been reported. Exclusively in D2 mice, we detected early microglia clustering in the inner central retina and unmyelinated optic nerve regions, with microglia activation peaking by 3 months of age. Between 5 and 8 months of age, activated microglia persisted and concentrated in the optic disc, but also localized to the retinal periphery. Collectively, our findings suggest microglia activation is an early alteration in the retina and optic nerve in D2 glaucoma, potentially contributing to disease onset or progression. Ultimately, detection of microglial activation may have value in early disease diagnosis, while modulation of microglial responses may alter disease progression.


Figures

Figure 1
Figure 1. Retinal microglia tile the vitreal surface and synaptic layers
Neural retinas showing Iba1 immunostaining (white) and nuclear counterstaining (blue). A) Radial section through the mid-peripheral retina from 1 month-old (mo) D2 mice. Microglia cells (Iba1+) position their somata at the NFL (cell #1), GCL (#2), inner (#3) or outer IPL (#4), and within the innermost surface of the OPL (#5). Cells localized to the NFL and GCL extend tangential processes along the vitreal surface, IPL microglia project complex arbors throughout the IPL, while microglia at the OPL send sturdy processes across the INL reaching the IPL or thinner and branched processes that line the INL outer surface. The absence of microglia in the ONL is prevalent, although their somata within the subretinal space sometimes project processes across the ONL (not shown). B-D) The whole mount view of a similar field lateral to the optic disc (asterisk) depict the parallel mosaics of retinal microglia. Same scale bar. B) At the depths corresponding to the NFL and GCL, microglia are aligned with blood vessels (space shown with dashed line), adopting a radial orientation towards the optic disc, while parenchymal microglia array more regularly. C) At the IPL, regularly tiled microglia show small somata and complex, wispy processes. D) Deeper, the OPL microglia exhibit very discrete non-overlapping territories like IPL microglia, but with higher Iba1 expression levels. B′-D′) High magnification views of parenchymal microglia corresponding to the dotted frames in B-D. Observe that these pairs of cells tile their territories and show diverse soma size and shape, number and branching complexity of primary processes, and Iba1 expression levels. These elements suggest different degrees of cell activation. Same scale bar.
Figure 2
Figure 2. Microglia show a compartmentalized distribution within the ONH and proximal optic nerve
Central retina stained as in Fig. 1A. A) A longitudinal section across the optic nerve head (ONH), lamina (OL) and nerve (ON), reveals the compartmentalization of microglia, which have lost the regularity of their mosaic. Within the regions that contain unmyelinated axons, microglia cluster in the innermost region of the ONH (arrow) and its periphery, as well as in a plane across the OL (between arrowheads). In the transition zone between the OL and ON, microglial cell density increases until becoming abundant in the ON. B-D) Whole mount views throughout the central retina show again the mosaic arrangement of microglia within the retinal layers. Instead, within the ONH microglia concentrate in the ONH, with cells showing enlarged somata oriented along its periphery. E-F) Cross-sections of the proximal optic nerve regions, display the presence of scarce cells in the OL with an array that delimit circular spaces. In the optic nerve, more abundant cells fill the section with more regularity.
Figure 3
Figure 3. Microglia are adjacent to all RGC compartments in D2 mice
(A-H) Confocal images showing the spatial relationship between RGCs and microglia in 3mo D2 retinas. Scale bars indicated in each image. A-C) Double immunostaining for Iba1 (white) and Brn3b (magenta) of retinal whole mounts. A) This view of the entire central retina, at the levels of the NFL and GCL, reveals both the geometry of the microglial mosaic and their distribution in relation to RGC nuclei. B) A higher magnification view of the GCL shows the localization of perivascular microglia (vertically across the center of the field), and of the parenchymal microglia intersperse between RGCs. C) A close up of RGC nuclei and microglia with diverse shape and complexity. Between 1 and 3 mo of age, we detect an approximate ratio of 1:18 microglia to RGCs along different GCL eccentricities. D) Double immunostaining for Iba1 (white) and MAP1 (magenta) of retinal sections spanning the GCL and IPL, shows the finest branches of microglial processes in direct apposition to RGC dendrites. E-G) Double immunostaining for Iba1 (white) and pNF (blue) of retinal whole mounts imaged at the NFL level. RGC axon bundles extend across the retina towards the optic disc (asterisk). Microglia intercalate with these bundles. F) A close up view of the optic disc region shows the dense coverage of microglia processes branching along the NFL, as well as the clustering of microglia at the optic disc. G) An individual microglial cell is shown with its soma and a thicker primary process stretching along a single RGC axon, while other very ramified processes from this cell reach across an axon bundle. The distance between microglial somata positioned along an axon bundle varies between 100 and 500 μm. H) A cross-section of the myelinated optic nerve shows the local population of microglial cells. The density of microglial cells is lower in the left region of the nerve where axonal pNF expression is normal. In comparison, the right half of the nerve shows abnormally reduced pNF expression and a higher density of microglia.
Figure 4
Figure 4. Microglia and astrocytes are contiguous to all RGC compartments
A, B-F) Retina double stained for Iba1 (white) and GFAP (red). A) A lateral view of the innermost layers of the peripheral retina from 1mo D2 mice, show that microglia and astrocytes (GFAP+) are adjacent to each other and to the monolayer of RGCs at the NFL. B) A whole mount view of a retina identically stained, displays the distribution of astrocytes with end feet wrapped around blood vessels, in close proximity to perivascular microglia. In the parenchyma, astrocytes organize as a continuous network, while microglia tile regularly. C) The aquaporin-4 immunostaining shows the radial Müller glia, whose end feet neighbor microglia at the GCL. Within the plexiform layers, microglia juxtapose Müller cell processes. D) The same field shown in Fig. 2A, is shown here with astrocytes stained with GFAP. The complex scaffold of astrocytes at the ONH and along the proximal optic nerve is contiguous to the subsets of microglia localized with a more restricted and differential pattern. Within the optic nerve (ON), microglia and astrocytes adopt a similar transverse orientation. E, F) Cross-sections of the proximal optic nerve regions (shown as single channel in Fig. 2E, F). E) Astrocytic processes within the OL delimit oval tunnels, where microglia localize peripherally. F) This organization is maintained within the initial segment of the ON. Here, there are relatively more abundant and smaller tunnels delimited by astrocytes, where a rich array of microglia is present. G) A high magnification view of the OL shows that microglial somata and processes line the glial tunnels (dashed shapes).
Figure 5
Figure 5. Iba1 reliably labels the entire mosaic of microglia resident in the retina
Confocal images of flat mounted retinas immunostained for Iba1 in 1mo GFP-Cx3cr1 mice, showed as maximum projection of innermost 25 μm. A) A view of the entire inner retina showing GFP+ microglia localized to the NFL and GCL. B) The retinal central field (box in A) displays the microglia co-expressing GFP (green) and Iba1 (magenta) with high localization (white areas), both around the optic disc and all towards the peripheral regions. C-E) The observation of the overlay and single channels at higher magnification (box in B) reveals that the overlap of Iba1 and GFP extend throughout the mosaic, both in parenchymal and perivascular microglia (vessel location indicated with dashed line in C). F-H) At the cell level (box in C-E), the overlay of GFP and Iba1 signals shows almost complete colocalization (F, white), spanning the cell soma and the complex ramifications, except for the finest processes (F, arrows). I-J) The color-coding of Iba1 expression intensity denotes variable expression levels within the mosaic and between different cell compartments. Maximal Iba1 expression intensity localizes to soma and branching points, with lowest levels extending the length of the cell processes.
Figure 6
Figure 6. Microglia cluster around the ONH by 3 months in D2 mice, but not in D2G
Confocal images of the inner (NFL, GCL and IPL) and the outer retina (OPL) of retinal whole mount immunostained for Iba1 are shown as maximum projection. The Iba1 channel is shown in pseudocolors to represent the relative intensity of expression. A) Representative samples from D2 mice at ages preceding RGC neurodegeneration (1, 3 and 5 months), when optic nerve pathology (8 months) or RGC death (12 months) are detectable. These images portraying microglia spatial distribution and activation levels reveal the relative increase in the intensity of Iba1 expression per cell by 3 months in the D2 central retina/ONH. Within the periphery, the inner retina undergoes microgliosis most evident by 8 months, although maintaining comparable levels of Iba1 expression across ages. Scale bars, 20 μm. B) Identical images of age-matched D2G control mice, acquired with the same confocal settings, show that no microgliosis or microglia activation develops in the central retina from 1 to 3 months of age or later. Also, no conspicuous changes in microglial density or Iba1 expression take place in the peripheral retina. Scale bars, 20 μm.
Figure 7
Figure 7. Iba1 upregulation is an early event in D2 central retina and proximal optic nerve compartments
Quantitative analysis of Iba1 protein and mRNA expression in D2 vs. D2G mice. A) Densitometric analysis of the intensity of Iba1 immunofluorescence (Alexa Fluor 555) emission per cell located at the NFL, GCL and IPL, within the central retina and ONH. Iba1 intensity is expressed as mean intensity per cell. At 1mo, D2 and D2G express comparable Iba1 levels (P<0.08). By 3 months of age, D2 samples upregulate Iba1 (2.1x in average), above D2G levels (2.6x). At 5 months of age, D2 decreased their Iba1 expression (0.8x) to intensity yet above that of D2G (1.4x). Afterwards, D2 central retinas and ONH samples stabilized their average Iba1 intensity levels, which were matched by the slow increase of Iba1 expression in D2G starting at 5 months of age. B-D) Iba1 mRNA expression is shown as mean fold change, normalized to beta-actin expression within each sample. B) Quantification of Iba1 mRNA expression levels within the central retina, ONH and lamina (OL). Iba1 mRNA expression peaks at 3-months of age in D2 mice (1.9x in average), followed by a significant reduction by 5 months (0.6x) which continues unaltered at later ages. D2G samples showed similar expression levels to D2 at 1 month of age, was less than half the D2 levels at 3 and 5 months (P<0.0001), to only match D2 levels by 8 months. By 12 months, D2G Iba1 expression dropped again to 1-5 month-levels. C) At 3 months of age, the proximal optic nerve of D2 mice showed significant upregulation of Iba1 mRNA relative to D2G samples (3x in average). D) Iba1 mRNA levels are maintained relatively low and unaltered across ages in D2 peripheral retina. E) Microphotograph showing the central retina compartment with attached lamina region (left) dissected out of the remaining peripheral retina (right). For panels A-D sample sizes per bar were, n=10 (A), n=10-15 (B), n=10 (C), and n=5 (D). Data within each mouse strain were compared for each age with the previous age (D2, blue asterisks; D2G, black). At the same age, red asterisks represent comparisons between D2 and D2G samples. Comparisons 2-tailed t-test P< 0.05 (*), < 0.01 (**), < 0.001 (***), < 0.0001 (****). Error bars represent S.E.M.
Figure 8
Figure 8. Microgliosis coincides with microglia activation in D2 retina and ONH
Microglia cell density (cell/mm2) was calculated from confocal images spanning the retinal and ONH depth from the NFL to the OPL in D2 and D2G mice aged 1 to 12 months. A) The numbers of microglia localized to the inner depths of the central retina and ONH show a significant increase in D2 samples from 1 month to 3 and 5 months of age (>1x in average). This trend continues at 8 months then decreases to about half the density by 12 months (P<0.05). However, D2G showed similar cell density to D2 at 1 and 3 months, which were maintained at 5 months, differing from D2's counts (1.5x higher in average). At 8 months, D2G increased their microglia density to levels comparable to D2, which showed a similar drop at 12 months. B) Microglia localized at the OPL in the central retina and ONH had the same density as those in the NFL to IPL in 1-month-old D2, and only decreased at 12 months (0P<0.05). In contrast, D2G OPL consistently maintained at all ages half the numbers of microglia found in D2 (P<0.001). C) At the mid-peripheral retina, microglia localized to inner layers changed with similar pattern to the inner central retina in D2 mice, except for statistical differences. Thus, they showed increases at 3 (1.2x in average) and 5 months, decreasing by 12 months. However, the cell counts in D2G samples maintained relative low densities, significantly below D2 values (1.7-2.3x higher in average). D) Deeper levels of the peripheral retina roughly followed the same changes described for the OPL at the central retina in both D2 and D2G mice, except for D2G having even lower densities of microglia at 3 months. A-D) Sample sizes per bar were, n=10. Comparisons represented as in Fig 7.

Similar articles

Cited by

References

    1. Anderson MG, Nair KS, Amonoo LA, Nehalow A, Trantow CM, Masli S, John SW. GpnmbR150X allele must be present in bone marrow derived cells to mediate DBA/2J glaucoma. BMC Genet. 2008;9:30. - PMC - PubMed
    1. Anderson DH, Neitz J, Kaska DD, Fenwick J, Jacobs GH, Fisher SK. Retinoid-binding proteins in cone-dominant retinas. Invest Ophthalmol Vis Sco. 1986;27:1015–1026. - PubMed
    1. Anderson MG, Smith RS, Hawes NL, Zabaleta A, Chang B, Wiggs JL, John SW. Mutations in genes encoding melanosomal proteins cause pigmentary glaucoma in DBA/2J mice. Nat Genet. 2002;30:81–85. - PubMed
    1. Autieri MV. cDNA cloning of human allograft inflammatory factor-1: tissue distribution, cytokine induction, and mRNA expression in injured rat carotid arteries. Biochem Biophys Res Commun. 1996;228:29–37. - PubMed
    1. Block ML, Zecca L, Hong JS. Microglia-mediated neurotoxicity: uncovering the molecular mechanisms. Nat Rev Neurosci. 2007;8:57–69. - PubMed

Publication types

MeSH terms