. 2011 Apr;49(4):152-8.
doi: 10.1002/mrc.2709. Epub 2011 Jan 18.

The fidelity of spin trapping with DMPO in biological systems

Affiliations

The fidelity of spin trapping with DMPO in biological systems

Kalina Ranguelova et al. Magn Reson Chem. 2011 Apr.

Abstract

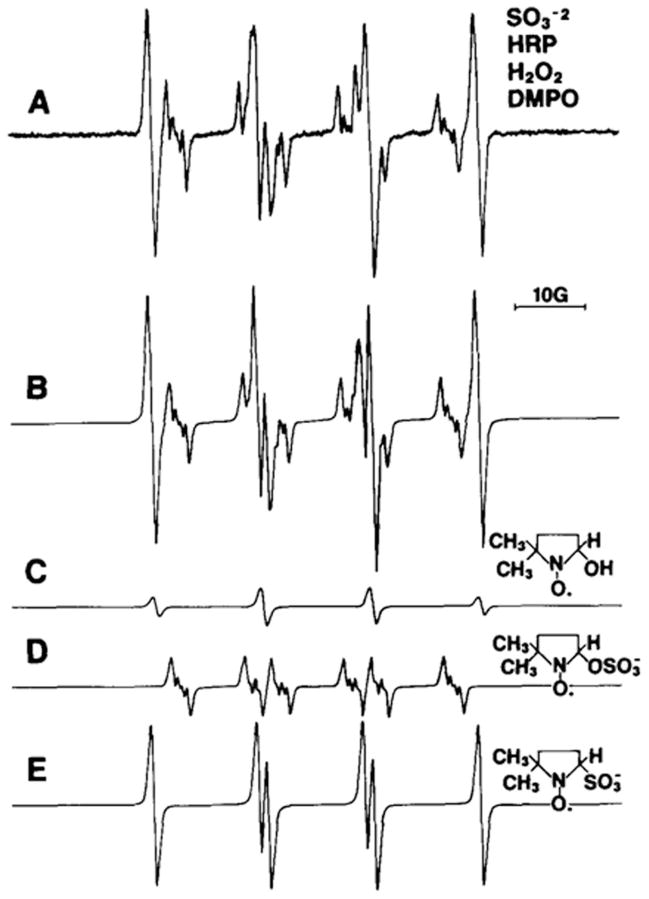
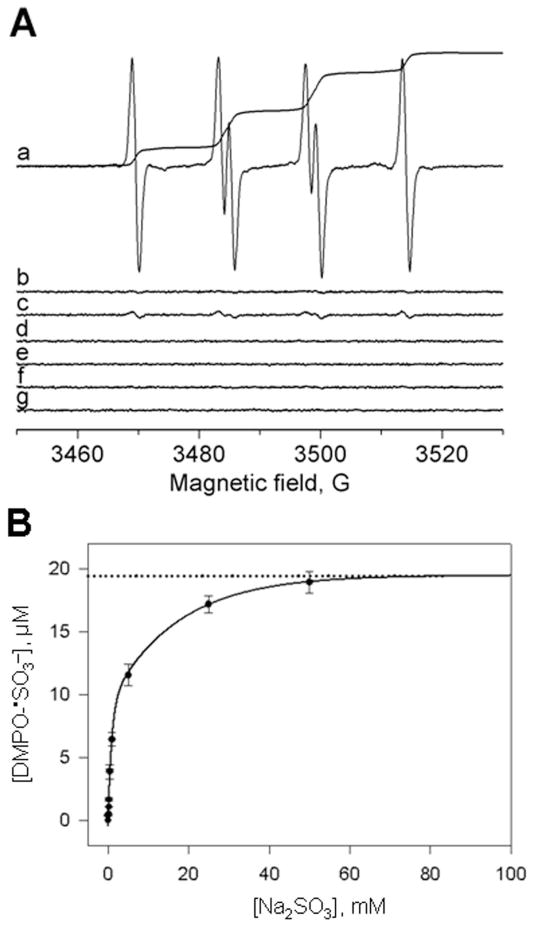
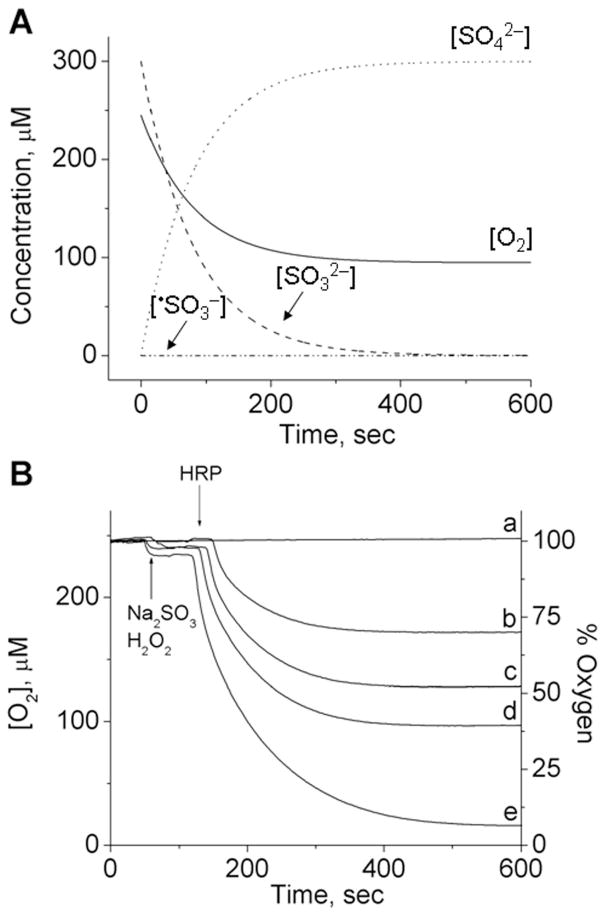
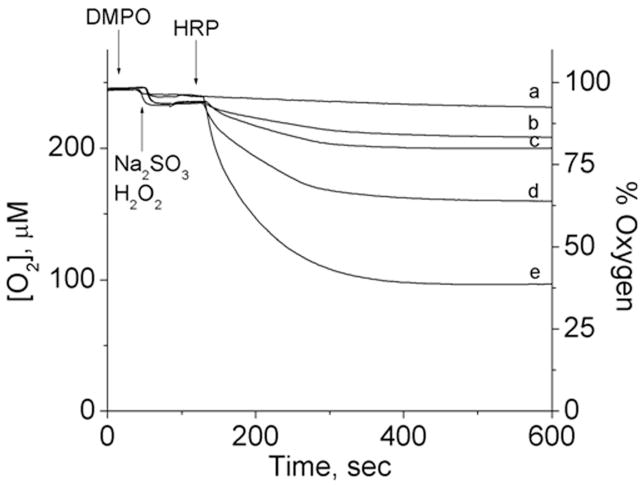
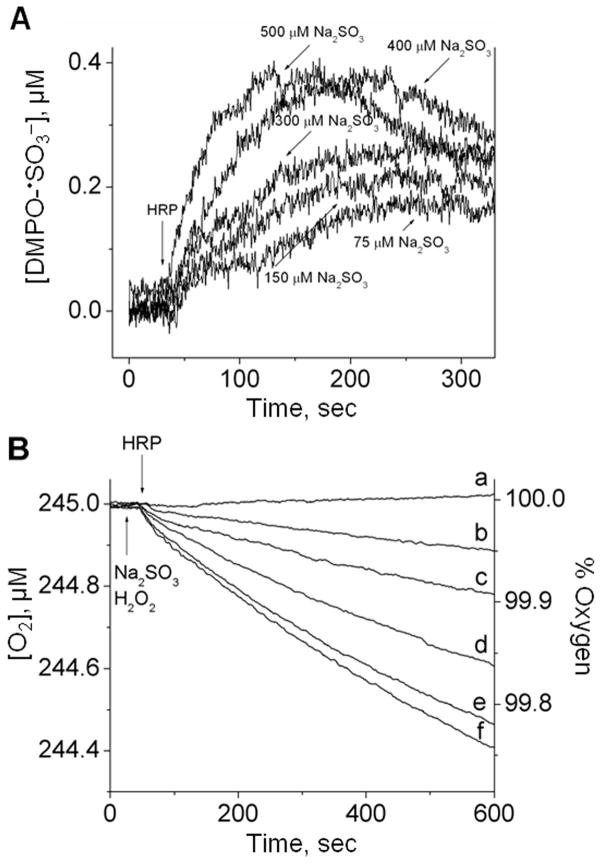
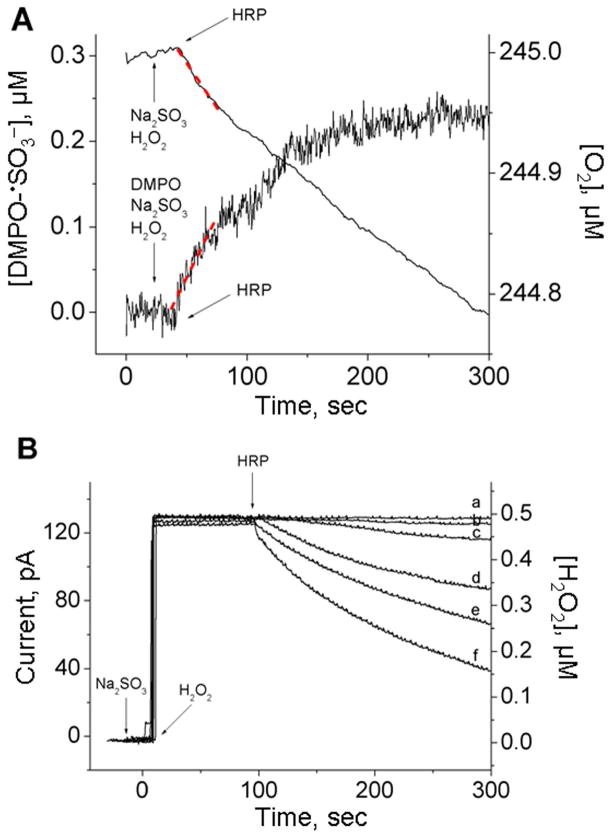
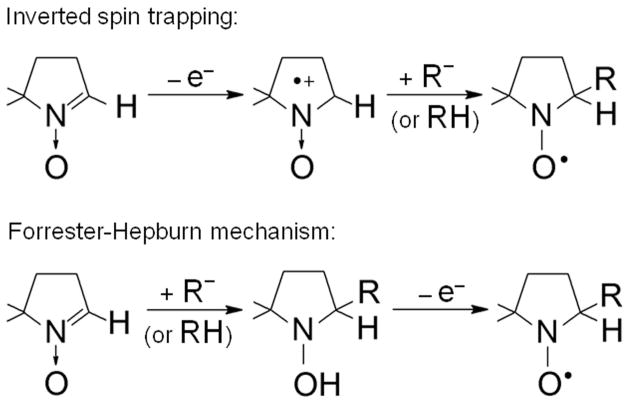
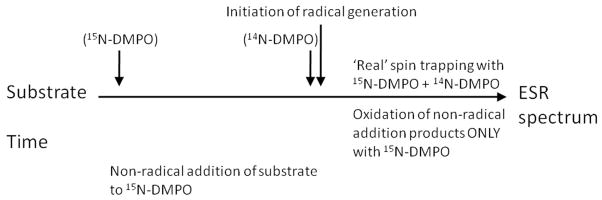
Unlike direct ESR, spin trap methodology depends on the absolute fidelity of the spin trap reaction. Two alternative reactions of 5,5-dimethyl-1-pyrroline N-oxide (DMPO) leading to radical adduct artifacts have been discovered and investigated: inverted spin trapping and the Forrester-Hepburn nucleophilic mechanism. These two alternate pathways to radical adducts are a combination of one-electron oxidation and nucleophilic addition, in either order. In biological systems, serious artifacts have been reported due to the Forrester-Hepburn mechanism, which is initiated by the addition of a nucleophile to DMPO. It has recently been demonstrated that (bi)sulfite (hydrated sulfur dioxide) can react with DMPO via a nonradical, nucleophilic reaction, and it has been further proposed that DMPO/(•)SO(3)(-) formation in biological systems is an artifact and not the result of spin trapping of sulfur trioxide anion radical ((•)SO(3)(-)). The one-electron oxidation of (bi)sulfite catalyzed by horseradish peroxidase (HRP)/hydrogen peroxide (H(2)O(2)) has been reinvestigated by ESR spin trapping with DMPO and oxygen uptake studies to obtain further evidence for the radical reaction mechanism. In the absence of DMPO, the initial rate of (bi)sulfite-dependent oxygen and H(2)O(2) consumption was determined to be half of the initial rate of DMPO/(•)SO(3)(-) radical adduct formation as determined by ESR, demonstrating that, under our experimental conditions, DMPO exclusively forms the radical adduct by trapping the (•)SO(3)(-).


Figures

Fig. 1
Fig. 1
(Spectrum A) Formation of radical adducts in the reaction between Na2SO3 (10 mM), DMPO (3 mM), HRP (0.25 mg/mL) and H2O2 (10 μM) in 100 mM phosphate buffer, pH 7.9. (Spectrum B) Computer simulation of the DMPO/OSO3 (aN = 13.8 G, aβH=10.1G, aHγ1 = 1.38 G, and aHγ2= 0.68 G), DMPO/SO3 (aN = 14.7 G, aβH=15.9G), and DMPO/OH (aN = 15.0 G, aβH=15.0G) radical adducts. (Spectrum C) Simulation of DMPO/OH radical adduct. (Spectrum D) Simulation of DMPO/OSO3 radical adduct. (Spectrum E) Simulation of DMPO/SO3 radical adduct. This figure is adapted from ref. [19].
Fig. 2
Fig. 2
(A) Formation of DMPO/SO3 radical adduct in the reaction between sodium sulfite (Na2SO3) and H2O2/HRP in the presence of DMPO. (Spectrum a) Reaction mixture containing Na2SO3 (50 mM), DMPO (100 mM) and H2O2 (10 μM) in 100 mM phosphate buffer, pH 7.4. After initiation with HRP (10 μM), the mixture was placed immediately into the flat cell. The double integral of the spectrum is proportional to the concentration of DMPO/SO3 radical adduct. (Spectrum b) Same as in (spectrum a) without HRP. (Spectrum c) Same as in (spectrum a) without H2O2. (Spectrum d) Same as in (spectrum c) with 30,000 units of catalase/mL of incubation. (Spectrum e) Same as in (spectrum a), except the Na2SO3 was not added. (Spectrum f) Same as in (spectrum a) without the spin trap. (Spectrum g) Same as in (spectrum b) without H2O2. The double integral values are an average of 64 scans. (B) Dependence of the concentration of DMPO/SO3 radical adduct on the (bi)sulfite concentrations in the presence of 10 μM H2O2. Reaction mixtures containing various concentrations of sodium sulfite (0.075, 0.150, 0.200, 0.300, 0.400, 0.500, 1, 5, 25 and 50 mM), DMPO (100 mM) and 10 μM H2O2 were initiated with 10 μM HRP in 100 mM phosphate buffer, pH 7.4. The concentration of the paramagnetic species was calculated from the double integrals of the ESR spectra. The estimated maximum concentration of DMPO/SO3 radical adduct obtained from the extrapolated nonlinear fit is 19.5 ± 0.3 μM. Error bars represent the standard deviation of three independent experiments. This figure is adapted from ref. [34].
Fig. 3
Fig. 3
(A) Computer simulation of the concentration changes of reactants as a function of time. The initial concentrations were: [O2]0 = 245 μM, [SO32−]0 = 300 μM, [SO3]0 = 1.4 × 10⁻⁷ μM, and [SO42−]0 = 0 μM. (B) Oxygen uptake curves as a function of (bi)sulfite concentration. Sodium sulfite (Na2SO3) was placed in a chamber with 10 μM H2O2 in 100 mM phosphate buffer, pH 7.4, and the reaction was initiated with 10 μM HRP at the times indicated. The concentration of (bi)sulfite for each curve was as follows: (a) 0 μM, (b) 150 μM, (c) 225 μM, (d) 300 μM and (e) 500 μM. This figure is adapted from ref. [34].
Fig. 4
Fig. 4
Oxygen uptake curves as a function of DMPO concentration. DMPO was placed in a chamber with sodium sulfite (300 μM) and H2O2 (10 μM) in 100 mM phosphate buffer, pH 7.4, and the reaction was initiated with 10 μM HRP at the times indicated. The concentration of DMPO for each curve was as follows: (a) 100 mM, (b) 10 mM, (c) 1 mM, (d) 0.1 mM and (e) 0 mM. This figure is adapted from ref. [34].
Fig. 5
Fig. 5
(A) Time-sweep ESR kinetics formation of DMPO/SO3 radical adduct. Reaction mixtures containing sodium sulfite as indicated, DMPO (100 mM) and H2O2 (0.5 μM) were initiated with 0.5 μM HRP in 100 mM phosphate buffer, pH 7.4. The instrument parameters were as follows: microwave frequency, 9.78 GHz; microwave power, 20 mW; modulation amplitude, 2.0 G; field position, 3468 G; receiver gain, 5 × 10⁵; time constant, 328 ms; and sweep time, 336 s. (B) Oxygen uptake curves using identical conditions as in Fig. 4A, except without spin trap DMPO. The concentration of sodium sulfite for each curve was as follows: (a) 0 μM, (b) 75 μM, (c) 150 μM, (d) 300 μM, (e) 400 μM and (f) 500 μM. This figure is adapted from ref. [34].
Fig. 6
Fig. 6
(A) ESR time course of DMPO/SO3 adduct formation in comparison with oxygen uptake curve. The solutions for both instruments contained 300 μM Na2SO3, 0.5 μM H2O2, 0.5 μM HRP as initiator and 100 mM DMPO (only for ESR spin trapping of SO3 radical). The instrumental conditions were the same as those described in the legend of Figure 5A for ESR. (B) Hydrogen peroxide consumption by HRP in the presence of sodium sulfite as a function of time. Na2SO3 was placed in a chamber with 0.5 μM H2O2 in 100 mM phosphate buffer, pH 7.4, and the reaction was initiated with 0.5 μM HRP at the times indicated. (a) H2O2 alone. The concentration of sodium sulfite for each curve was as follows: (b) 0 μM, (c) 100 μM, (d) 300 μM, (e) 400 μM and (f) 500 μM. This figure is adapted from ref. [34].
Scheme 1
Scheme 1
Scheme 2
Scheme 2
(adapted from ref [48])

References

    1. Beauchamp C, Fridovich I. Anal Biochem. 1971;44:276. - PubMed
    1. McCord JM, Fridovich I. J Biol Chem. 1968;243:5753. - PubMed
    1. Janzen EG, Haire DL. Adv Free Radic Chem. 1990;1:253.
    1. Knecht KT, Mason RP. Arch Biochem Biophys. 1993;303:185. - PubMed
    1. Davies MJ, Hawkins CL. Free Radic Biol Med. 2004;36:1072. - PubMed

Publication types

LinkOut - more resources