. 2011 Jan 19:12:45.
doi: 10.1186/1471-2164-12-45.

Comparative analysis of information contents relevant to recognition of introns in many species

Affiliations

Comparative analysis of information contents relevant to recognition of introns in many species

Hiroaki Iwata et al. BMC Genomics. .

Abstract

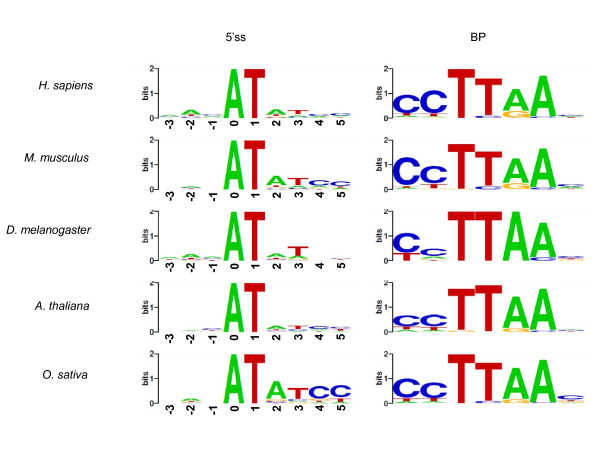
Background: The basic process of RNA splicing is conserved among eukaryotic species. Three signals (5' and 3' splice sites and branch site) are commonly used to directly conduct splicing, while other features are also related to the recognition of an intron. Although there is experimental evidence pointing to the significant species specificities in the features of intron recognition, a quantitative evaluation of the divergence of these features among a wide variety of eukaryotes has yet to be conducted.

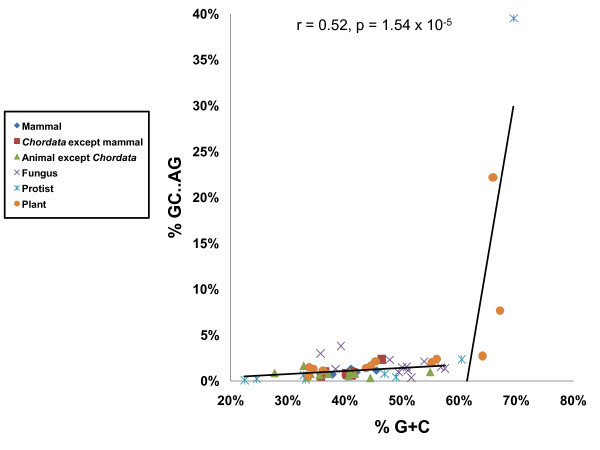
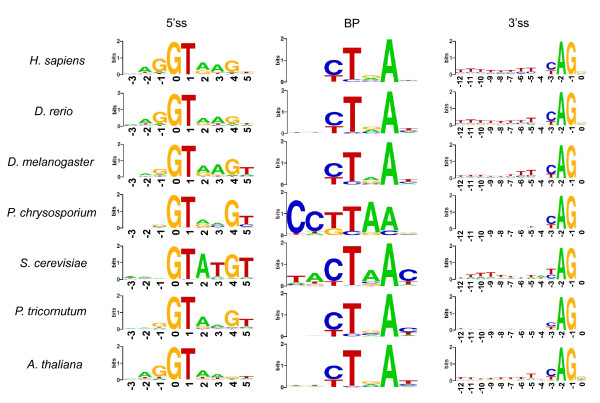
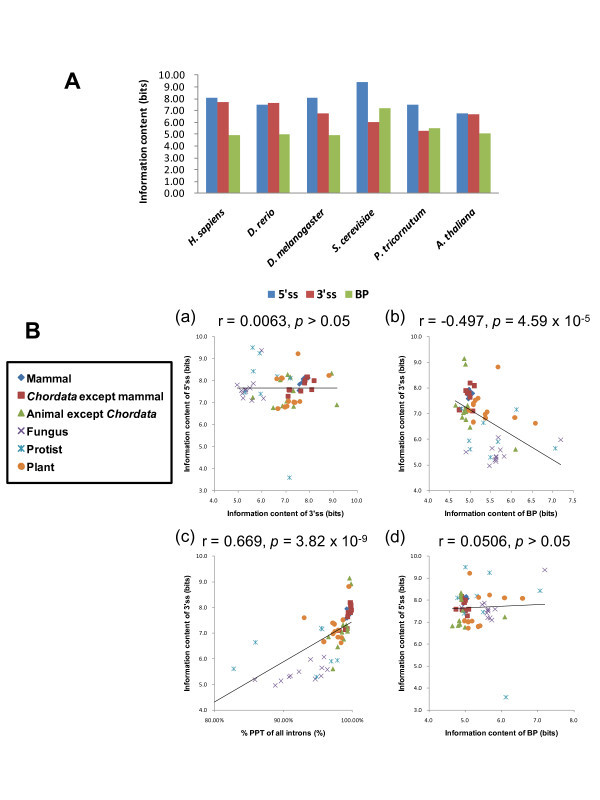
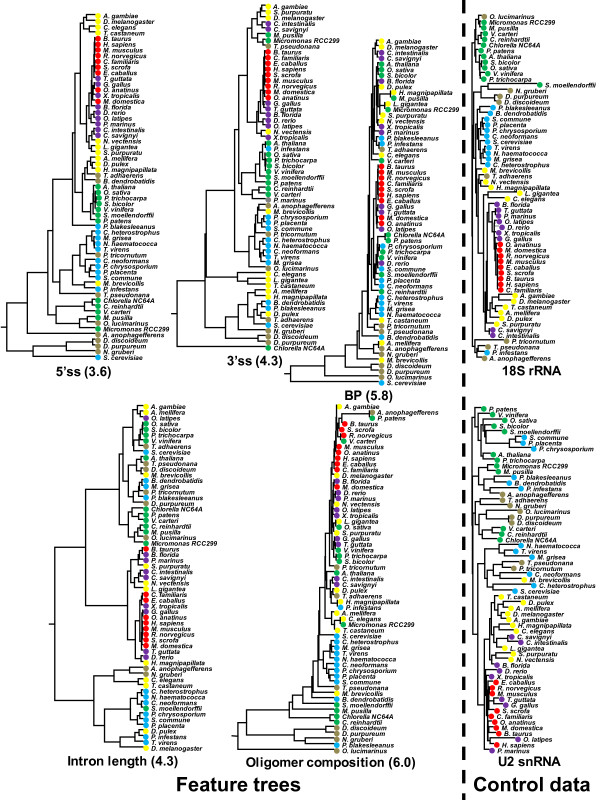
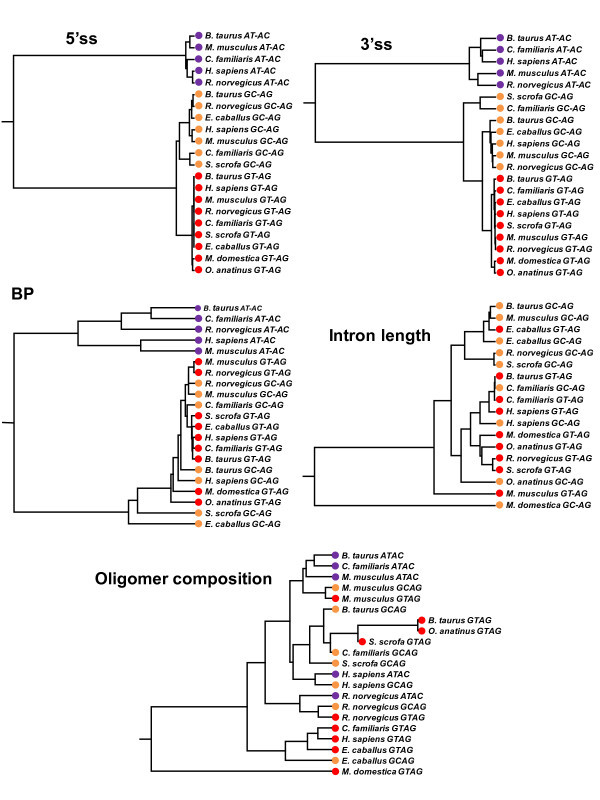
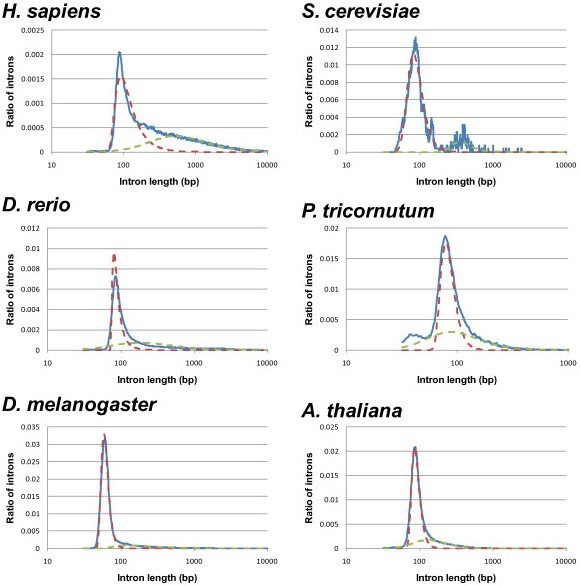
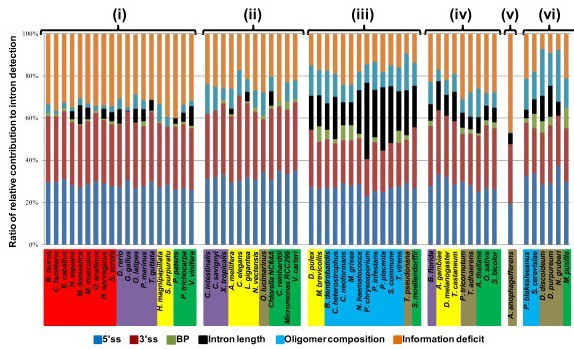
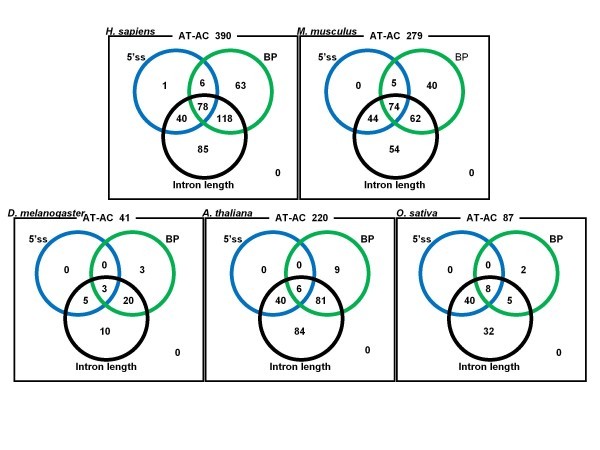
Results: To better understand the splicing process from the viewpoints of evolution and information theory, we collected introns from 61 diverse species of eukaryotes and analyzed the properties of the nucleotide sequences relevant to splicing. We found that trees individually constructed from the five features (the three signals, intron length, and nucleotide composition within an intron) roughly reflect the phylogenetic relationships among the species but sometimes extensively deviate from the species classification. The degree of topological deviation of each feature tree from the reference trees indicates the lowest discordance for the 5' splicing signal, followed by that for the 3' splicing signal, and a considerably greater discordance for the other three features. We also estimated the relative contributions of the five features to short intron recognition in each species. Again, moderate correlation was observed between the similarities in pattern of short intron recognition and the genealogical relationships among the species. When mammalian introns were categorized into three subtypes according to their terminal dinucleotide sequences, each subtype segregated into a nearly monophyletic group, regardless of the host species, with respect to the 5' and 3' splicing signals. It was also found that GC-AG introns are extraordinarily abundant in some species with high genomic G + C contents, and that the U12-type spliceosome might make a greater contribution than currently estimated in most species.

Conclusions: Overall, the present study indicates that both splicing signals themselves and their relative contributions to short intron recognition are rather susceptible to evolutionary changes, while some poorly characterized properties seem to be preserved within the mammalian intron subtypes. Our findings may afford additional clues to understanding of evolution of splicing mechanisms.


Figures

Figure 1
Figure 1
The correlation plot between genomic G + C content and the fraction of GC-AG introns. The right regression line was obtained from the data of the five species with the highest genomic G + C contents, while the left regression line was derived from the data of the other species.
Figure 2
Figure 2
Splicing signal motifs of seven species. Sequence motifs for 5'ss, 3'ss, and BP are depicted by Sequence logos WebLogo http://weblogo.berkeley.edu/. The relative height of each letter is proportional to the relative entropy of the corresponding base at the given position, and bases are listed in descending order of frequency from top to bottom.
Figure 3
Figure 3
Information contents and correlations of three splice signal motifs. (A) The information contents of 5'ss (blue), 3'ss (red), and BP (green) motifs are measured in bits. Results for only representative species are shown here. Complete numerical data are presented in Additional file 4. (B) Correlation between (a) information contents of 3'ss and 5'ss, (b) information contents of BP and 3'ss, (c) % PPT of all introns and information content of 3'ss, and (d) information contents of BP and 5'ss. 61 species are categorized into six groups, as shown in the legend on the left. The Pearson correlation coefficient and the significance thereof are shown on top of each plot.
Figure 4
Figure 4
Five feature trees and reference trees for the 61 species. Mammal (red), Chordata except mammal (purple), animal except Chordata (yellow), fungus (blue), protist (beige), and plant (green). The number in parentheses indicates the mean of RMSD values between the feature tree and the reference trees derived from multiple sequence alignments of 18S rRNAs and U2 snRNAs. The means and standard deviations of the RMSD values obtained from the random tests with 100 trials and the p-values estimated there from are as follows. 5'ss: 6.0 ± 0.1 (p = 1.4 × 10-127), 3'ss: 6.1 ± 0.2 (p = 1.1 × 10⁻¹⁹), BP: 6.3 ± 0.2 (p = 6.2 × 10⁻³), intron length: 5.6 ± 0.1 (p = 6.1 × 10-39) and oligomer composition: 6.9 ± 0.2 (p = 3.4 × 10⁻⁶).
Figure 5
Figure 5
Feature trees constructed from mammalian intron data. Taxa of each feature tree are categorized into subtypes according to the terminal dinucleotides of the introns, GT-AG (red), GC-AG (orange), and AT-AC (purple). For statistical reasons, only intron data with GT-AG and GC-AG, and other data with more than 100 instances are used for this analysis.
Figure 6
Figure 6
Length distributions of all introns from six species. The blue solid line shows the observed length distribution. The dashed lines (red and green) show individual components of two Frechet distributions fitted to the observed distribution with the maximum likelihood method.
Figure 7
Figure 7
K-means clustering analysis of contributions of the five features to intron recognition. Mammal (red), Chordata except mammal (purple), animal except Chordata (yellow), fungus (blue), protist (beige), and plant (green).
Figure 8
Figure 8
5'ss and BP motif profiles of all AT-AC introns in five representative species. The reported consensus sequences of U12-type 5'ss signal and BP are "ATATCC" and "CCTTAAC," respectively.
Figure 9
Figure 9
Venn diagrams of AT-AC introns that satisfy the three criteria. Each circle represents the fraction of AT-AC introns that satisfy one of the three U12-type criteria described in the text.

References

    1. Black DL. Mechanisms of alternative pre-messenger RNA splicing. Annu Rev Biochem. 2003;72:291–336. doi: 10.1146/annurev.biochem.72.121801.161720. - DOI - PubMed
    1. Douris V, Telford MJ, Averof M. Evidence for multiple independent origins of trans-splicing in Metazoa. Mol Biol Evol. 2009;27:684–693. doi: 10.1093/molbev/msp286. - DOI - PubMed
    1. Ast G. How did alternative splicing evolve? Nat Rev Genet. 2004;5:773–782. doi: 10.1038/nrg1451. - DOI - PubMed
    1. Berglund JA, Chua K, Abovich N, Reed R, Rosbash M. The splicing factor BBP interacts specifically with the pre-mRNA branchpoint sequence UACUAAC. Cell. 1997;89:781–787. doi: 10.1016/S0092-8674(00)80261-5. - DOI - PubMed
    1. Lim LP, Burge CB. A computational analysis of sequence features involved in recognition of short introns. Proc Natl Acad Sci USA. 2001;98:11193–11198. doi: 10.1073/pnas.201407298. - DOI - PMC - PubMed

Publication types

LinkOut - more resources