. 2011 Mar 18;286(11):9321-37.
doi: 10.1074/jbc.M110.168088. Epub 2011 Jan 19.

Proprotein convertases process Pmel17 during secretion

Affiliations

Proprotein convertases process Pmel17 during secretion

Ralf M Leonhardt et al. J Biol Chem. .

Abstract

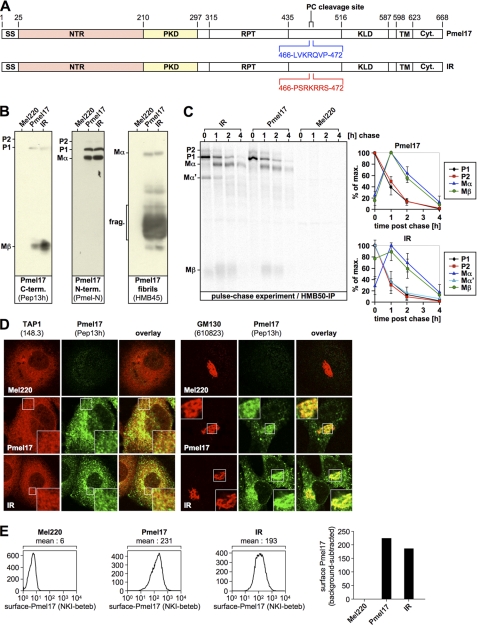
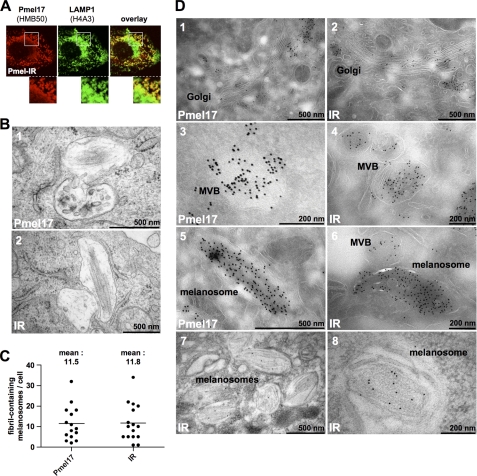
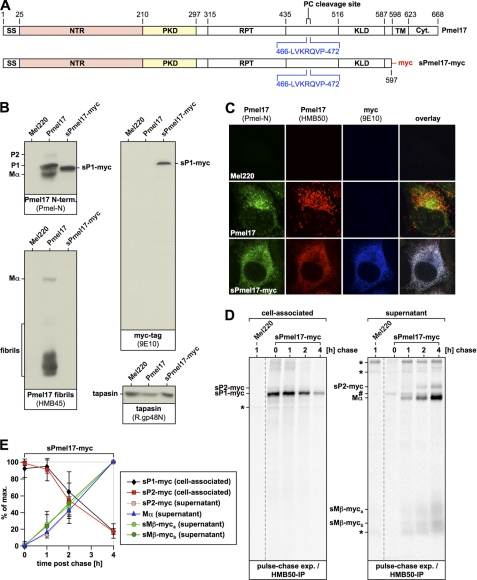
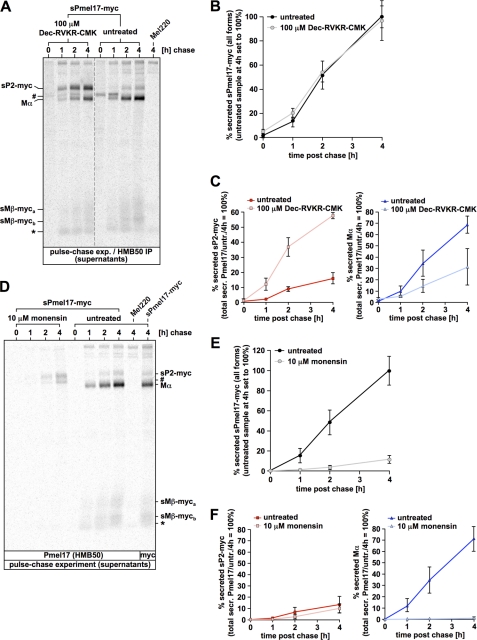
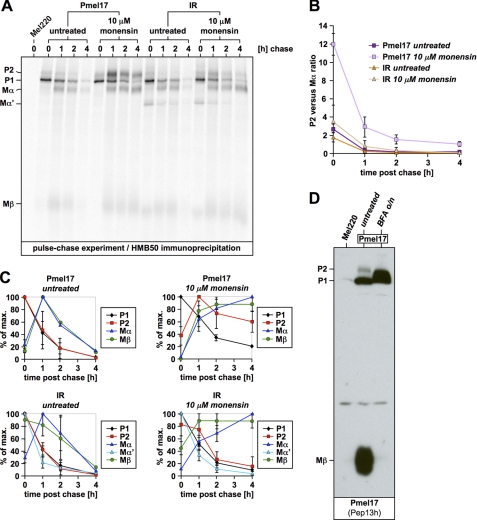
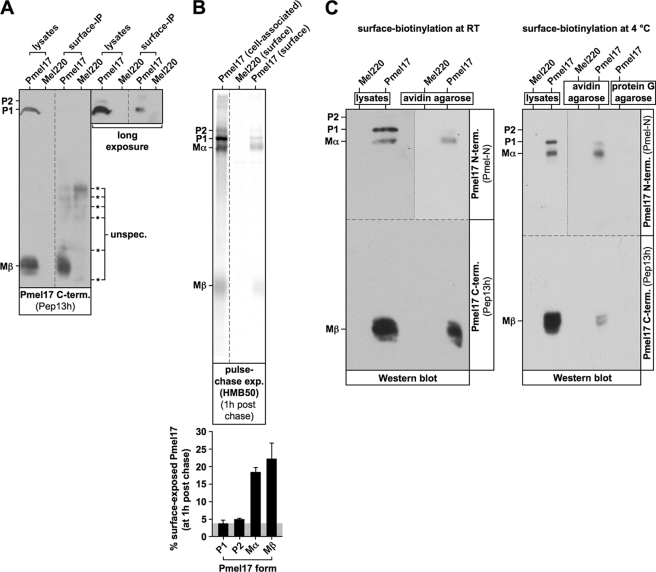
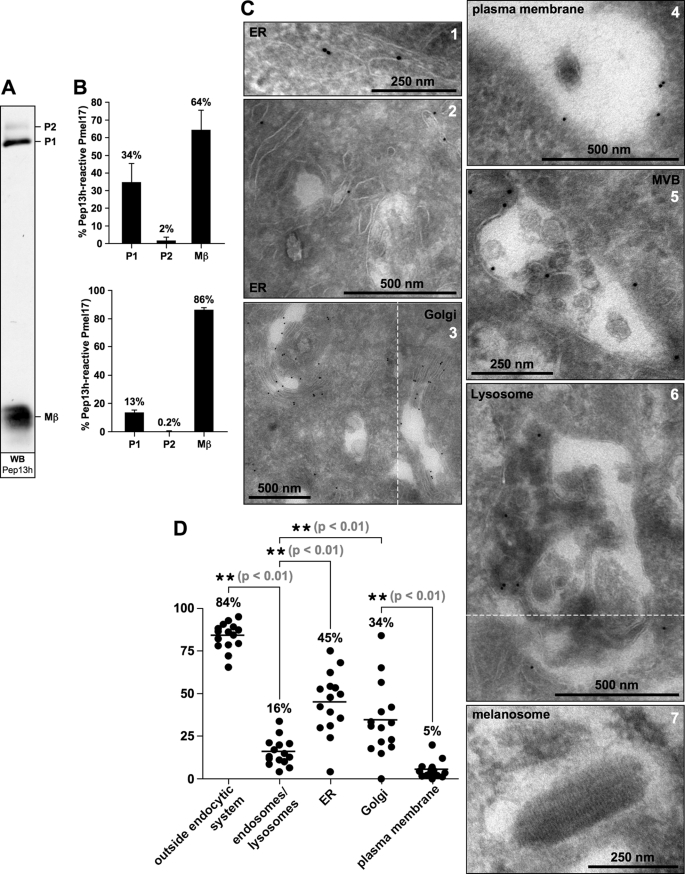
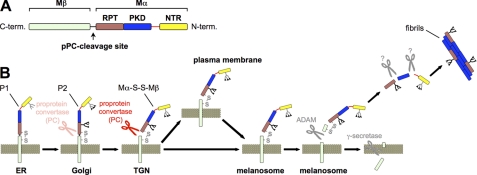
Pmel17 is a melanocyte/melanoma-specific protein that traffics to melanosomes where it forms a fibrillar matrix on which melanin gets deposited. Before being cleaved into smaller fibrillogenic fragments the protein undergoes processing by proprotein convertases, a class of serine proteases that typically recognize the canonical motif RX(R/K)R↓. The current model of Pmel17 maturation states that this processing step occurs in melanosomes, but in light of recent reports this issue has become controversial. We therefore addressed this question by thoroughly assessing the processing kinetics of either wild-type Pmel17 or a secreted soluble Pmel17 derivative. Our results demonstrate clearly that processing of Pmel17 occurs during secretion and that it does not require entry of the protein into the endocytic system. Strikingly, processing proceeds even in the presence of the secretion inhibitor monensin, suggesting that Pmel17 is an exceptionally good substrate. In line with this, we find that newly synthesized surface Pmel17 is already quantitatively cleaved. Moreover, we demonstrate that Pmel17 function is independent of the sequence identity of its unconventional proprotein convertase-cleavage motif that lacks arginine in P4 position. The data alter the current view of Pmel17 maturation and suggest that the multistep processing of Pmel17 begins with an early cleavage during secretion that primes the protein for later functional processing.


Figures

FIGURE 1.
FIGURE 1.
The sequence identity of the endogenous proprotein convertase-cleavage motif within Pmel17 is not essential for proper early maturation. A, schematic representation of the IR construct. B, IR is processed by pPCs to give rise to Mα, Mβ, and HMB45-reactive fibrillogenic fragments. A total membrane fraction derived from the indicated stable Mel220 transfectants was lysed in 1% SDS, 1% β-mercaptoethanol + protease inhibitors (Complete, Roche Applied Science) and analyzed by Western blot using Pmel17-specific antibodies. C, IR displays a relatively normal early maturation. Cells from B were pulse-labeled for 30 min with 35S and subsequently chased for the indicated times. 2% Triton X-100 lysates were immunoprecipitated with Pmel17-specific antibody HMB50, eluted with 0.5% SDS by boiling for 5 min, and analyzed by autoradiography (left panel). Quantitative PhosphorImager analysis of the pulse-chase data with maximal levels for each band set to 100% is shown (right panel). Error bars reflect the standard deviation from the mean of two independent experiments. D, newly synthesized IR localizes to the ER and Golgi apparatus. Cells from B were analyzed by immunofluorescence using antibodies against newly synthesized Pmel17 (Pep13h) and organelle markers TAP1 (148.3) (ER) or GM130 (610823) (Golgi). A higher magnification of the indicated area is shown as an inset within each image. E, IR is expressed at the cell surface. Cells from B were surface labeled with antibody NKI-beteb against folded Pmel17 and analyzed by flow cytometry (histograms on the left). After background subtraction (untransfected Mel220 cells) data are represented as a bar diagram (right panel).
FIGURE 2.
FIGURE 2.
The sequence identity of the endogenous proprotein convertase-cleavage motif within Pmel17 is not essential for fibril formation. A, most IR in the cell is distributed in a melanosomal pattern, distinct from lysosomes. Mel220 cells stably expressing the IR mutant were analyzed by immunofluorescence using antibodies against folded Pmel17 (HMB50) and LAMP1 (H4A3). A higher magnification of the indicated area is shown at the bottom of each image. B, Mel220 cells expressing IR harbor fibril-containing melanosomes. Electron microscopic analysis of Epon-embedded Mel220 transfectants stably expressing wt-Pmel17 (upper panel) or IR (lower panel). C, IR and wt-Pmel17 are equally efficient in fibril formation. Fibril-containing melanosomes were counted in Epon-embedded samples of Mel220 cells stably expressing wt-Pmel17 or mutant IR. D, IR mostly localizes to fibrils. Mel220 cells expressing wt-Pmel17 or mutant IR were fixed and examined by cryo-immuno-EM (panels 1–6) or by immunolabeling of LR gold-embedded samples (panels 7 and 8) with antibody HMB50. Shown are the Golgi apparatus (panels 1 and 2), multivesicular bodies (MVB) (panels 3 and 4), or melanosomes (panels 5–8).
FIGURE 3.
FIGURE 3.
A soluble Pmel17 mutant gets secreted from cells in a proprotein convertase-cleaved form. A, schematic representation of the sPmel17-myc construct. B, only the ER-associated P1 form can be detected for sPmel17-myc inside the cells at steady-state. Membrane lysates of Mel220 transfectants stably expressing sPmel17-myc were prepared as in Fig. 1B and analyzed by Western blot using Pmel17-specific antibodies, myc-specific antibodies, or tapasin-specific antibodies for control. C, almost all intracellular sPmel17-myc is localized to the ER. Cells from B were analyzed by immunofluorescence using antibodies against newly synthesized Pmel17 (Pmel-N), mature Pmel17 (HMB50), or the myc-tag (9E10). D, soluble sPmel17-myc gets secreted into the culture medium. Mel220 transfectants stably expressing sPmel17-myc were pulse-labeled for 30 min with 35S and subsequently chased for the indicated times. 2% Triton X-100 lysates (left panel) or culture supernatants (right panel) were immunoprecipitated with Pmel17-specific antibody HMB50, eluted with 0.5% SDS by boiling for 5 min, and analyzed by autoradiography. The dashed lines indicate positions where irrelevant lanes have been removed from the image. The pound symbol indicates background levels of the precipitated P1 form. The asterisks indicate nonspecifically precipitated proteins. E, quantitative PhosphorImager analysis of the pulse-chase data in D and a second independent experiment with maximal levels for each band set to 100%. Error bars reflect the mean ± S.D. of these two independent experiments.
FIGURE 4.
FIGURE 4.
Proprotein convertase-mediated cleavage of sPmel17-myc is inhibited by Dec-RVKR-CMK or monensin. A, cleavage of sPmel17-myc is sensitive to proprotein convertase inhibitor Dec-RVKR-CMK. Mel220 transfectants stably expressing sPmel17-myc were pulse-labeled for 30 min with 35S and subsequently chased for the indicated times. During both labeling and chase, 100 μm Dec-RVKR-CMK was included (four left lanes) or no inhibitor was included at all (fifth to eighth lanes). Culture supernatants were immunoprecipitated with Pmel17-specific antibody HMB50, eluted with 0.5% SDS by boiling for 5 min, and analyzed by autoradiography. The dashed line indicates a position where irrelevant lanes have been removed from the image. The pound symbol indicates background levels of the precipitated P1 form. The asterisk indicates a nonspecifically precipitated protein. B, total secretion is not affected by Dec-RVKR-CMK. Quantitative PhosphorImager analysis of the pulse-chase data in A is shown. The figure displays the total amount of all secreted sPmel17-myc forms (total released protein under untreated conditions at chase time point 4 h set to 100%). Error bars reflect the mean ± S.D. of two independent experiments. C, treatment with Dec-RVKR-CMK impairs proprotein convertase-mediated cleavage of the P2 form of sPmel17-myc. Quantitative PhosphorImager analysis of the pulse-chase data in A is shown. The figure displays the amount of secreted sP2-myc (left panel) or Mα (right panel) (total released protein under untreated conditions at chase time point 4 h set to 100%). Error bars reflect the mean ± S.D. of two independent experiments. D, cleavage of sPmel17-myc is sensitive to the secretion inhibitor monensin. Mel220 transfectants stably expressing sPmel17-myc were pulse labeled for 30 min with 35S and subsequently chased for the indicated times. During both labeling and chase, 10 μm monensin was included (four left lanes) or no inhibitor was included at all (five right lanes). Culture supernatants were immunoprecipitated with Pmel17-specific antibody HMB50 (nine left lanes) or myc-specific antibody ab9106 (last lane on the right), eluted with 0.5% SDS by boiling for 5 min and analyzed by autoradiography. The pound symbol indicates background levels of the precipitated P1 form. The asterisk indicates a nonspecifically precipitated protein. E, total secretion is almost completely suppressed by monensin. Quantitative PhosphorImager analysis of the pulse-chase data in D is shown. The figure displays the total amount of all secreted sPmel17-myc forms (total released protein under untreated conditions at chase time point 4 h set to 100%). Error bars reflect the mean ± S.D. of two independent experiments. F, treatment with monensin impairs proprotein convertase-mediated cleavage of the P2 form of sPmel17-myc. Quantitative PhosphorImager analysis of the pulse-chase data in D is shown. The figure displays the amount of secreted sP2-myc (left panel) or Mα (right panel) (total released protein under untreated conditions at chase time point 4 h set to 100%). Error bars reflect the mean ± S.D. of two independent experiments.
FIGURE 5.
FIGURE 5.
Brefeldin A, but not monensin treatment abrogates proprotein convertase-mediated processing of Pmel17. A, monensin treatment does not abrogate proprotein convertase-mediated processing of Pmel17. Mel220 transfectants stably expressing wt-Pmel17 or IR were pulse-labeled for 30 min with 35S and subsequently chased for the indicated times. During both labeling and chase, 10 μm monensin was included (sixth to ninth and 14th to 17th lanes 6–9) or no inhibitor was included at all (first to fifth lanes and 10th to 13th). 2% Triton X-100 lysates were immunoprecipitated with Pmel17-specific antibody HMB50, eluted with 0.5% SDS by boiling for 5 min, and analyzed by autoradiography. B, quantitative PhosphorImager analysis of the pulse-chase data in A and a second independent experiment (supplemental Fig. S5) is shown. The figure displays the ratio of the P2 form versus the Mα fragment at the indicated time points of chase. Error bars reflect the mean ± S.D. of the two independent experiments. C, quantitative PhosphorImager analysis of the pulse-chase data in A and a second independent experiment (supplemental Fig. S5) with maximal levels for each band set to 100% is shown. Error bars reflect the mean ± S.D. of two independent experiments. D, Mel220 transfectants stably expressing wt-Pmel17 were treated or not with 10 μg/ml of brefeldin A (BFA) overnight and subsequently analyzed by Western blot using the Pmel17-specific antibody Pep13h.
FIGURE 6.
FIGURE 6.
Surface Pmel17 is already in a proprotein convertase-cleaved state. A, all Pmel17 at the cell surface is already in a proprotein convertase-cleaved state. Mel220 transfectants stably expressing wt-Pmel17 were incubated on ice with Pmel17-specific antibody HMB50, then extensively washed and lysed in 2% Triton X-100 before protein A-Sepharose beads were added to specifically immunoprecipitate the surface population of Pmel17. Immunoprecipitates (third, fourth, seventh, and eighth lanes) or corresponding total cell lysates (first, second, fifth, and sixth lanes) were analyzed by Western blot using antibody Pep13h. A shorter (first to fourth lanes) and a longer (fifth to eighth lanes) exposure of the same membrane is shown. The dashed line indicates a position where irrelevant lanes have been removed from the image. The asterisks indicate nonspecifically precipitated proteins. Note that the ER P1 form (present in total cell lysate, but not in the surface-IP sample) serves as an internal control in the experiment. B, newly synthesized Pmel17 at the cell surface is already in a proprotein convertase-cleaved state. Mel220 transfectants stably expressing wt-Pmel17 were pulse-labeled for 30 min with 35S and subsequently chased for 1 h. Antibody HMB50 was added to the intact cells on ice, before extensive washing, lysis in 2% Triton X-100, and addition of protein A-Sepharose beads to specifically immunoprecipitate the surface population of Pmel17 (second and third lanes). In parallel, a 2% Triton X-100 total cell lysate (lane 1) was immunoprecipitated with Pmel17-specific antibody HMB50 as described in the legend to Fig. 1C. Immunoprecipitates were subsequently analyzed by autoradiography (upper panel). For quantification, the ratio of surface-immunoprecipitated (lane 3) versus total cell-associated Pmel17 forms (P1, P2, Mα, and Mβ) (first lane) was determined. Note that this percentage is almost equally low for the P2 form and the ER-located P1 form, which serves as an indicator for background precipitation (gray shaded area). Only Mα and Mβ are precipitated above this background. Error bars reflect the mean ± S.D. of two independent experiments. The dashed line indicates a position where irrelevant lanes have been removed from the image. C, all Pmel17 at the cell surface is already in a proprotein convertase-cleaved state. Cells from A were surface-biotinylated at room temperature according to the protocol of the manufacturer (left panel) or at 4 °C to avoid any residual endocytosis during this step (right panel). Subsequently, biotinylated surface proteins were precipitated using avidin-agarose. Protein G-agarose was used as a specificity control. These samples (third and fourth lanes in left panel and third to fifth in right panel) or total cell lysates (first and second lanes in left and right panels) were analyzed by Western blot using Pmel17-specific antibodies Pep13h and Pmel-N. The horizontal dashed lines separate the regions of the membrane that were incubated with antibody Pmel-N (upper part) and antibody Pep13h (lower part), respectively. The vertical dotted lines separate longer (right part) or shorter (left part) exposures of the same membrane. Note that the ER P1 form (present in total cell lysate, but only marginally in the avidin-precipitation samples) serves as an internal control in the experiment.
FIGURE 7.
FIGURE 7.
Proprotein convertase-cleaved Pmel17 partially distributes along the secretory route. A, the peptide antibody Pep13h predominantly recognizes cleaved Pmel17 (Mβ) at steady-state. A total cell lysate of Mel220 cells stably expressing wt-Pmel17 was analyzed by Western blot using antibody Pep13h, which recognizes the extreme C terminus of Pmel17. One typical example of numerous experiments is shown. B, quantitative Western blotting was performed on Pep13h-stained membranes like the one shown in Fig. 7A. The intensity of Pep13h-stained, Pmel17-specific bands (P1 + P2 + Mβ = 100%) shows the strongest labeling of pPC-cleaved Pmel17 (Mβ) followed by lower levels of ER-associated Pmel17 (P1) and only negligible levels of P2. Two independent experiments are shown (top and bottom panels). C, Pep13h-specific labeling of wt-Pmel17 in Mel220 cells is predominantly found along the secretory route and only to a minor extent in the endocytic system. Mel220 cells expressing wt-Pmel17 were fixed and examined by cryo-immuno-EM using antibody Pep13h. Shown is Pep13h-specific labeling in the ER (panels 1 and 2), in the Golgi apparatus (panel 3), on the plasma membrane (panel 4), and in multivesicular bodies (MVB) (panel 5). Only occasionally is labeling observed in lysosomes (panel 6) and melanosomes are not stained at all (panel 7). D, the majority of Pep13h-reactive Pmel17 distributes along the secretory route. The Pep13h-specific immunolabeling outside (ER, Golgi apparatus, and plasma membrane) and inside the endocytic system (endosomal and lysosomal) was quantified in 15 entire cells and the percentage of labeling associated with a particular organelle is shown. Each dot corresponds to one cell.
FIGURE 8.
FIGURE 8.
Model of Pmel17 maturation. A, schematic domain structure of Pmel17. The pPC cleavage site is located between the lumenal RPT domain and the transmembrane domain. B, model of Pmel17 maturation based on our results. Pmel17 is synthesized as a ∼100 kDa precursor in the ER (so-called P1 form) that quickly migrates to the Golgi where its oligosaccharides get modified, which leads to a large shift in the apparent molecular weight (so-called P2 form). Proprotein convertase cleavage might occur as early as in this compartment. However, the major fraction of the protein may be cleaved only in the pPC-rich trans-Golgi network, thereby generating an N-terminal Mα- and a membrane-tethered C-terminal Mβ-fragment. The two fragments remain linked to each other via a disulfide bridge (Mα-S-S-Mβ). In this form Pmel17 gets translocated to early stage melanosomes. Some protein may route there directly from the TGN, but a large fraction accesses melanosomes only via the plasma membrane. Part of the protein gets shed there from the cell surface. In melanosomes, an unknown trigger induces cleavage of Pmel17 by a metalloprotease of the ADAM family, which releases a soluble Mα derivative, which gets further cleaved into at least two (probably non-overlapping) sets of fragments: those containing the PKD domain (reactive with antibody I51) and those containing the RPT domain (reactive with antibody HMB45). These fragments eventually assemble into mature fibrils.

References

    1. Theos A. C., Truschel S. T., Raposo G., Marks M. S. (2005) Pigment Cell Res. 18, 322–336 - PMC - PubMed
    1. Fowler D. M., Koulov A. V., Alory-Jost C., Marks M. S., Balch W. E., Kelly J. W. (2006) PLoS Biol. 4, e6. - PMC - PubMed
    1. Lee Z. H., Hou L., Moellmann G., Kuklinska E., Antol K., Fraser M., Halaban R., Kwon B. S. (1996) J. Invest. Dermatol. 106, 605–610 - PubMed
    1. Quevedo W. C., Fleischmann R. D., Dyckman J. (1981) in Phenotypic Expression in Pigment Cells (Seiji M. ed) pp. 177–184, Tokyo University Press, Tokyo
    1. Yamaguchi Y., Hearing V. J. (2009) BioFactors 35, 193–199 - PMC - PubMed

Publication types

LinkOut - more resources