. 2011 Apr;85(7):3649-63.
doi: 10.1128/JVI.02197-10. Epub 2011 Jan 19.

Coevolution of the hepatitis C virus polyprotein sites in patients on combined pegylated interferon and ribavirin therapy

Affiliations

Coevolution of the hepatitis C virus polyprotein sites in patients on combined pegylated interferon and ribavirin therapy

James Lara et al. J Virol. 2011 Apr.

Abstract

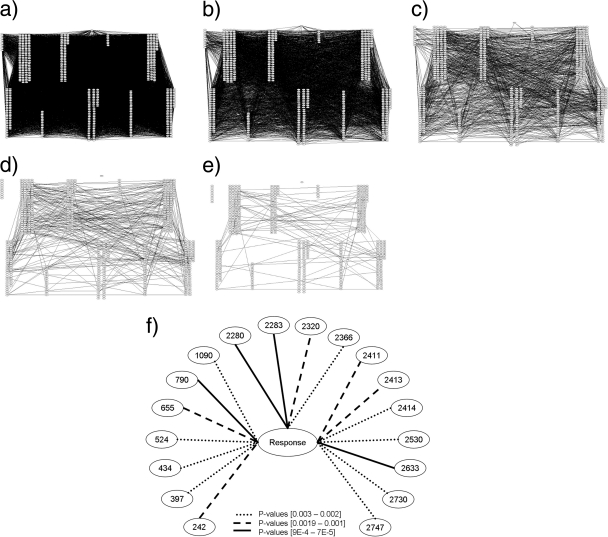
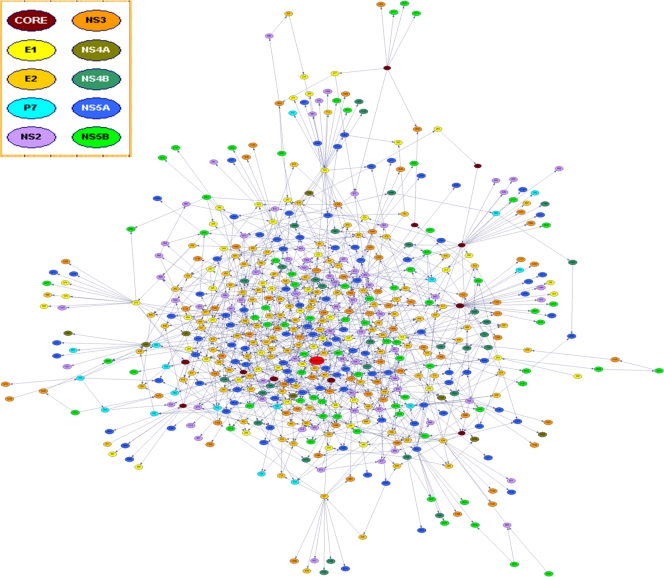
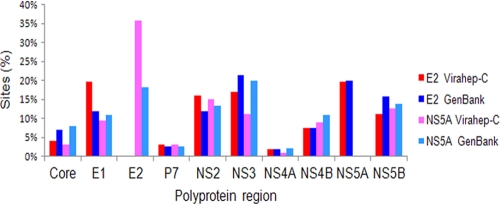
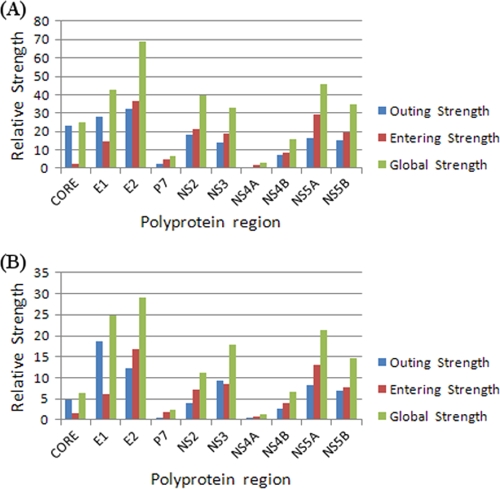
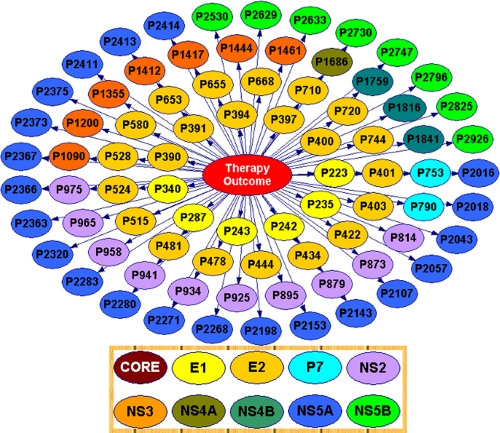
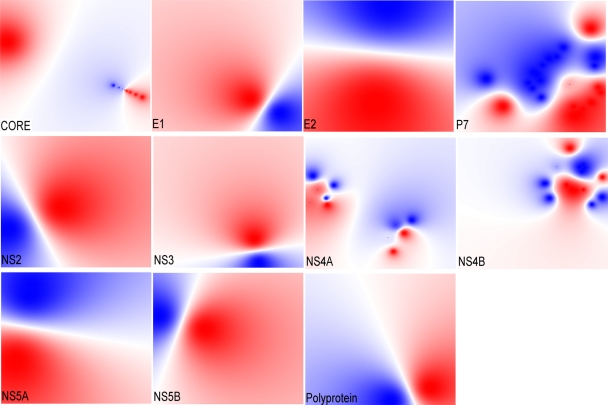
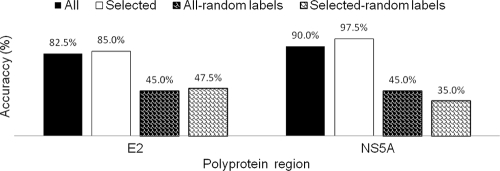
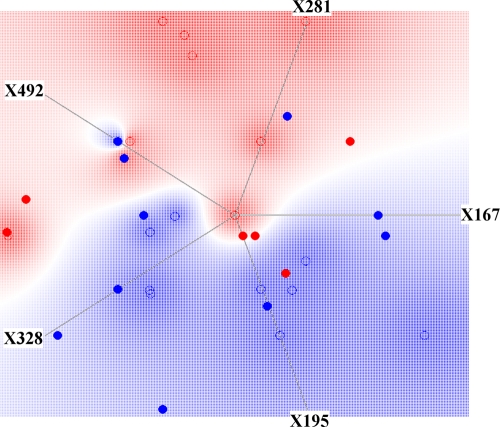
Genotype-specific sensitivity of the hepatitis C virus (HCV) to interferon-ribavirin (IFN-RBV) combination therapy and reduced HCV response to IFN-RBV as infection progresses from acute to chronic infection suggest that HCV genetic factors and intrahost HCV evolution play important roles in therapy outcomes. HCV polyprotein sequences (n = 40) from 10 patients with unsustainable response (UR) (breakthrough and relapse) and 10 patients with no response (NR) following therapy were identified through the Virahep-C study. Bayesian networks (BNs) were constructed to relate interrelationships among HCV polymorphic sites to UR/NR outcomes. All models showed an extensive interdependence of HCV sites and strong connections (P ≤ 0.003) to therapy response. Although all HCV proteins contributed to the networks, the topological properties of sites differed among proteins. E2 and NS5A together contributed ∼40% of all sites and ∼62% of all links to the polyprotein BN. The NS5A BN and E2 BN predicted UR/NR outcomes with 85% and 97.5% accuracy, respectively, in 10-fold cross-validation experiments. The NS5A model constructed using physicochemical properties of only five sites was shown to predict the UR/NR outcomes with 83.3% accuracy for 6 UR and 12 NR cases of the HALT-C study. Thus, HCV adaptation to IFN-RBV is a complex trait encoded in the interrelationships among many sites along the entire HCV polyprotein. E2 and NS5A generate broad epistatic connectivity across the HCV polyprotein and essentially shape intrahost HCV evolution toward the IFN-RBV resistance. Both proteins can be used to accurately predict the outcomes of IFN-RBV therapy.


Figures

FIG. 1.
FIG. 1.
Undirected independence graphs showing relative strengths of the dependencies (links in the graph) found among HCV polyprotein sites (nodes in the graph) and UR/NR outcomes following IFN-RBV therapy from 40 sequences obtained from 10 UR and 10 NR patients in the Virahep-C data. Feature pairs whose dependencies exceed the threshold are linked. HCV polyprotein sites are grouped by region; from left to right: core, E2, NS2, NS4A, and NS5A (upper row), and E1, P7, NS3, NS4B, NS5B (lower row). Therapy outcome is shown as a single node at the top of the graphs. (a) Initial explorative search for significant dependencies (P < 0.05) followed by gradual decrease in thresholds: 0.0032 (b), 3 × 10⁻⁴ (c), 6 × 10⁻⁵ (d), and 5 × 10⁻⁶ (e). (f) Reduced diagram of summarized dependencies between HCV polyprotein sites and treatment outcome (P ≤ 0.003).
FIG. 2.
FIG. 2.
BN (P = 3) of inferred relationships among the full-length HCV polyprotein sites and IFN-RBV therapy outcome. Polyprotein sites and outcome are represented as nodes in the graph. Relationships among features are represented as arcs. Features whose probabilistic dependencies exceed the conditional independency tests and GTT scoring are connected. The graph was constructed using a spring-embedded network layout algorithm. Features are color-coded by region (inset), and therapy outcome is shown in red.
FIG. 3.
FIG. 3.
Distribution of links among polymorphic sites of the HCV 1a NS5A or E2 proteins with other viral proteins in the HCV polyprotein BN. E2 and NS5A interrelationships are compared between the HCV polyprotein BNs inferred from GenBank data and Virahep-C data. Sites (%), percentage of sites from each region that were linked to sites from NS5A or E2.
FIG. 4.
FIG. 4.
Relative strength and direction of links associated with individual HCV proteins in the Virahep-C BN (A) and GenBank BN (B). The total strength of all outgoing links (blue bars), incoming links (red bars), and the global strength (green bars) are shown for each protein.
FIG. 5.
FIG. 5.
BN with selection of relevant sites linked to the UR/NR outcomes. Site selections were based on the BN choice of relevant features for outcome prediction. A total of 80 HCV polyprotein sites are shown. Nodes are color coded by region (inset).
FIG. 6.
FIG. 6.
Contribution of the UR/NR-relevant sites from individual HCV proteins identified using four filtering methods.
FIG. 7.
FIG. 7.
Total strength of association between sites of individual HCV proteins and the UR/NR outcome.
FIG. 8.
FIG. 8.
Relative significance of association of the HCV polyprotein sites to the UR/NR outcome. Only sites with relative significance of >0.5 are shown. Color code: black, E1; red, E2; green, P7; yellow, NS2; blue, NS5A; and cyan, NS5B. Relative significance is a ratio between the mutual information brought by each feature and the greatest mutual information.
FIG. 9.
FIG. 9.
Physicochemical projection of HCV polyprotein and individual proteins. Shown are the optimized 2D linear projections. Variation in shade of colors reflects probability estimates for UR (red) and NR (blue) outcomes, with darker shades corresponding to greater probability values.
FIG. 10.
FIG. 10.
10-fold CV performance of the E2 BNC and NS5A BNC constructed using all polymorphic sites (black bar) and selected relevant sites (white bar). Results for BNCs with randomized labels are shown using patterned bars (black for all and white for selected sites).
FIG. 11.
FIG. 11.
Projection of five selected physicochemical features of five NS5A sites from the HALT-C sequence data set onto the physicochemical space-based model derived from the Virahep-C sequence data set. Lines originating from the center of the graph are projections of five physicochemical features. Circles in the graph map the UR/NR outcomes of therapy for Virahep-C (unfilled circles) and HALT-C (filled circles). For color coding, see legend to Fig. 9.

Similar articles

Cited by

References

    1. Abid, K., R. Quadri, and F. Negro. 2000. Hepatitis C virus, the E2 envelope protein, and alpha-interferon resistance. Science 287:1555. - PubMed
    1. Andre, P., G. Perlemuter, A. Budkowska, C. Brechot, and V. Lotteau. 2005. Hepatitis C virus particles and lipoprotein metabolism. Semin. Liver Dis. 25:93-104. - PubMed
    1. Reference deleted.
    1. Appel, N., et al. 2008. Essential role of domain III of nonstructural protein 5A for hepatitis C virus infectious particle assembly. PLoS Pathog. 4:e1000035. - PMC - PubMed
    1. Appel, N., et al. 2008. Essential role of domain III of nonstructural protein 5A for hepatitis C virus infectious particle assembly. PLoS Pathog. 4:e1000035. - PMC - PubMed

Publication types

LinkOut - more resources