. 2011 Apr 28;117(17):4609-14.
doi: 10.1182/blood-2010-07-297671. Epub 2011 Jan 19.

Visualization and identification of the structures formed during early stages of fibrin polymerization

Affiliations

Visualization and identification of the structures formed during early stages of fibrin polymerization

Irina N Chernysh et al. Blood. .

Abstract

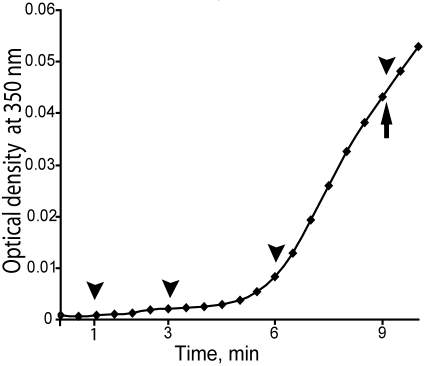
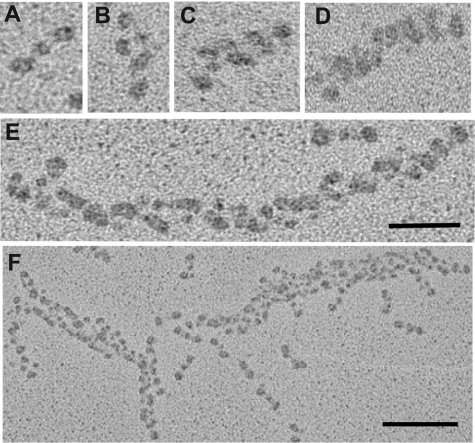
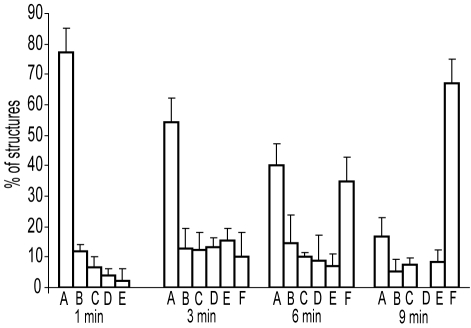
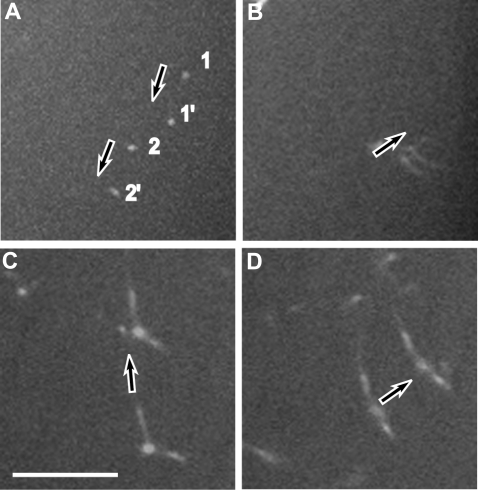
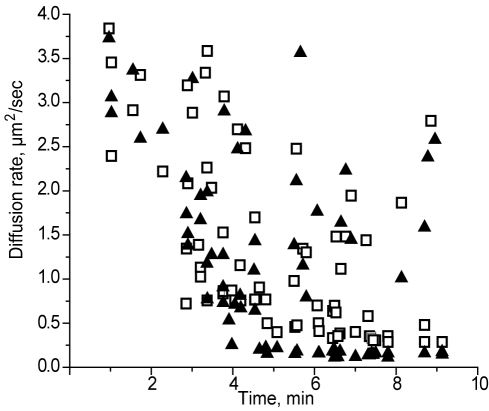
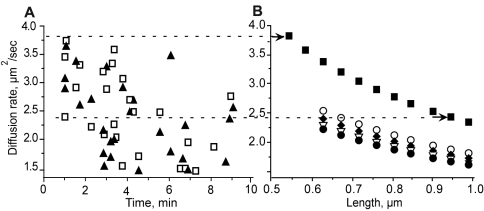
We determined the sequence of events and identified and quantitatively characterized the mobility of moving structures present during the early stages of fibrin-clot formation from the beginning of polymerization to the gel point. Three complementary techniques were used in parallel: spinning-disk confocal microscopy, transmission electron microscopy, and turbidity measurements. At the beginning of polymerization the major structures were monomers, whereas at the middle of the lag period there were monomers, oligomers, protofibrils (defined as structures that consisted of more than 8 monomers), and fibers. At the end of the lag period, there were primarily monomers and fibers, giving way to mainly fibers at the gel point. Diffusion rates were calculated from 2 different results, one based on sizes and another on the velocity of the observed structures, with similar results in the range of 3.8-0.1 μm²/s. At the gel point, the diffusion coefficients corresponded to very large, slow-moving structures and individual protofibrils. The smallest moving structures visible by confocal microscopy during fibrin polymerization were identified as protofibrils with a length of approximately 0.5 μm. The sequence of early events of clotting and the structures present are important for understanding hemostasis and thrombosis.


Figures

Figure 1
Figure 1
Initial part of the turbidity curve from the beginning of polymerization to the gel point. Turbidity curves were averaged from 3 identical experiments. The lag phase was 0-345 ± 10 seconds, and the gel point at 540 ± 11 seconds. Arrowheads show the time when the polymerization reaction was stopped and samples were taken for transmission electron microscopy studies. The arrow shows the gel point.
Figure 2
Figure 2
Transmission electron micrographs showing representative fibrin structures. Structures can be identified as: (A) monomers, (B) dimers, (C) trimers, (D) tetramers, (E) protofibrils, and (F) fibers. Scale bars, 50 nm (A-E) and 100 nm (F).
Figure 3
Figure 3
Histograms showing the percentage of fibrin structures visualized by electron microscopy at 1, 3, 6, and 9 minutes during fibrin polymerization. All types of structures that appear in the images were counted in each micrograph. The number of monomers within each type of structure was calculated and normalized by the number of monomers present in the whole micrograph. Structures can be identified as: (A) fibrin monomers, (B) dimers, (C) trimers, (D) tetramers, (E) larger oligomers and protofibrils, and (F) fibers.
Figure 4
Figure 4
Z projections of 2 spinning-disk confocal micrographs at different times. This technique was used to measure the displacement of each individual fibrin structure during a known time interval to calculate the velocity. (A) Displacement of a fibrin structure during 0.6 seconds. (B) Displacement of another moving structure during 0.6 seconds. (C) Projection of 2 Z sections, one 6 minutes and 5 seconds and another one 6 minutes and 21 seconds from the beginning of polymerization. (D) Projection of 2 Z sections, one at 6 minutes and 54 seconds and another one at 7 minutes and 5 seconds. Arrows show the direction of movement. 1 and 1′ correspond to one moving structure; 2 and 2′ correspond to another moving structure. Scale bar represents 10 μm.
Figure 5
Figure 5
Diffusion rates of fibrin structures calculated by 2 different methods as a function of time. Calculations were based on the sizes (▴) or on the velocities (□) of moving structures.
Figure 6
Figure 6
Identification of fibrin structures by comparison of diffusion coefficients obtained from experimental data with those calculated for model structures with different lengths and thicknesses. (A) Diffusion coefficients obtained from experimental data. Calculations were based on size (▴) or on the velocities (□) of moving structures. (B) Diffusion coefficients are shown for one protofibril (■), 2 protofibrils (○), 3 protofibrils (♦), 4 protofibrils (▿), and 5 protofibrils (●). The dashed lines connecting panels A and B show the correlations between the measured (A) and calculated (B) diffusion coefficients, so it is possible to deduce what the structures observed could be (arrows at the right end of the dashed lines). For example, the top dashed line, for one of the largest diffusion coefficients measured, 3.8 μm2/s, corresponds to a protofibril with a length of 0.54 μm. The lower dashed line is another example showing the possible fibrin structures that correspond to a diffusion rate of 2.4 μm2/s, a single protofibril with a length of 0.95 μm, 2 laterally aggregated protofibrils with a length of 0.62 μm, or 3 laterally aggregated protofibrils with a length of 0.67 μm.

Comment in

  • To gel or not to gel.
    Galanakis DK. Galanakis DK. Blood. 2011 Apr 28;117(17):4406-7. doi: 10.1182/blood-2011-02-332767. Blood. 2011. PMID: 21527539 No abstract available.

Similar articles

Cited by

References

    1. Doolittle RF. Fibrinogen and fibrin. Annu Rev Biochem. 1984;53:195–229. - PubMed
    1. Cierniewski CS, Kloczewiak M, Budzynski AZ. Expression of primary polymerization sites in the D domain of human fibrinogen depends on intact conformation. J Biol Chem. 1986;261(20):9116–9121. - PubMed
    1. Litvinov RI, Gorkun OV, Owen SF, Shuman H, Weisel JW. Polymerization of fibrin: specificity, strength, and stability of knob-hole interactions studied at the single-molecule level. Blood. 2005;106(9):2944–2951. - PMC - PubMed
    1. Fowler WE, Erickson HP, Hantgan RR, McDonagh J, Hermans J. Cross-linked fibrinogen dimers demonstrate a feature of the molecular packing in fibrin fibers. Science. 1981;211(4479):287–289. - PubMed
    1. Weisel JW, Phillips GN, Jr., Cohen C. A model from electron microscopy for the molecular structure of fibrinogen and fibrin. Nature. 1981;289(5795):263–267. - PubMed

Publication types