. 2011 Jan 19;31(3):801-8.
doi: 10.1523/JNEUROSCI.3389-10.2011.

Opposing gradients of ribbon size and AMPA receptor expression underlie sensitivity differences among cochlear-nerve/hair-cell synapses

Affiliations

Opposing gradients of ribbon size and AMPA receptor expression underlie sensitivity differences among cochlear-nerve/hair-cell synapses

Leslie D Liberman et al. J Neurosci. .

Abstract

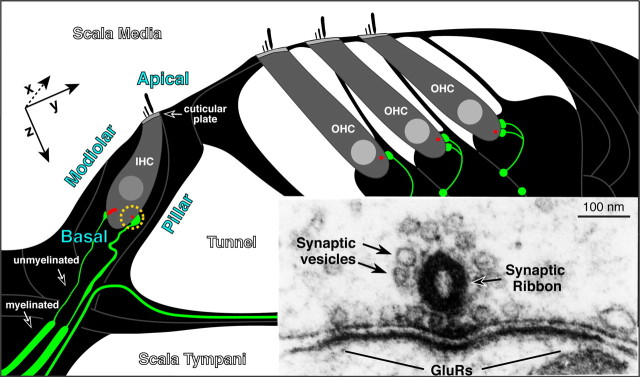
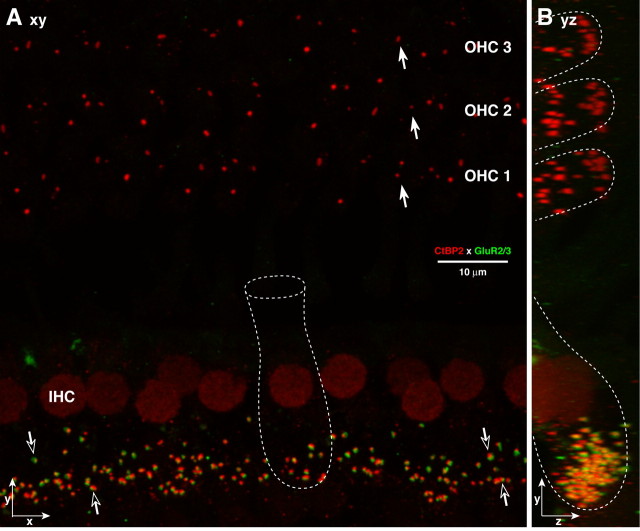
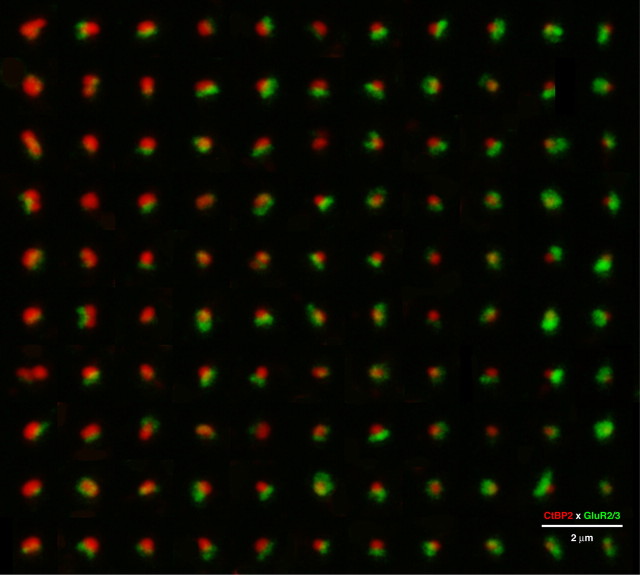
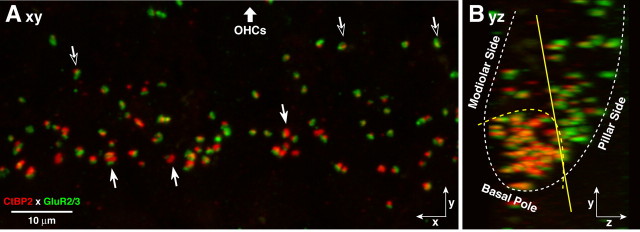
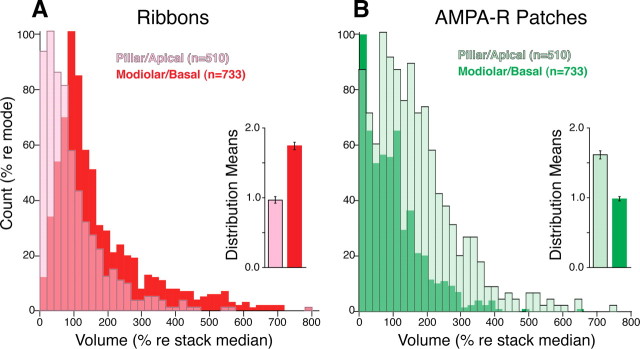
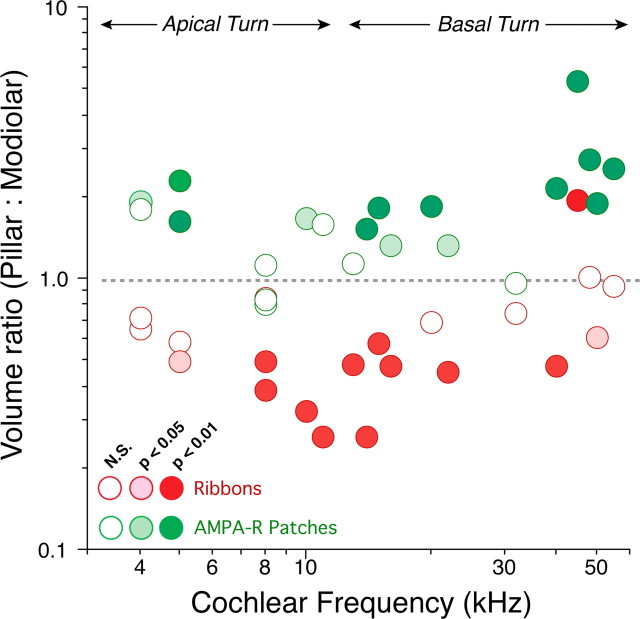
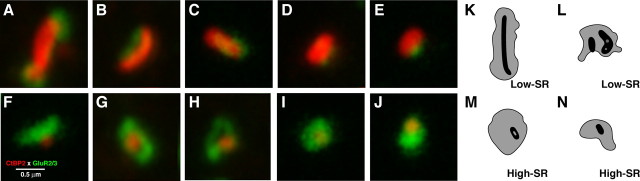
The auditory system transduces sound-evoked vibrations over a range of input sound pressure levels spanning six orders of magnitude. An important component of the system mediating this impressive dynamic range is established in the cochlear sensory epithelium, where functional subtypes of cochlear nerve fibers differ in threshold sensitivity, and spontaneous discharge rate (SR), by more than a factor of 1000 (Liberman, 1978), even though, regardless of type, each fiber contacts only a single hair cell via a single ribbon synapse. To study the mechanisms underlying this remarkable heterogeneity in threshold sensitivity among the 5-30 primary sensory fibers innervating a single inner hair cell, we quantified the sizes of presynaptic ribbons and postsynaptic AMPA receptor patches in >1200 synapses, using high-power confocal imaging of mouse cochleas immunostained for CtBP2 (C-terminal binding protein 2, a major ribbon protein) and GluR2/3 (glutamate receptors 2 and 3). We document complementary gradients, most striking in mid-cochlear regions, whereby synapses from the modiolar face and/or basal pole of the inner hair cell have larger ribbons and smaller receptor patches than synapses located in opposite regions of the cell. The AMPA receptor expression gradient likely contributes to the differences in cochlear nerve threshold and SR seen on the two sides of the hair cell in vivo (Liberman, 1982a); the differences in ribbon size may contribute to the heterogeneity of EPSC waveforms seen in vitro (Grant et al., 2010).


Figures

Figure 1.
Figure 1.
Schematic cross section through the cochlear epithelium showing the unmyelinated afferent terminals (green) on IHCs and OHCs and the presynaptic ribbons at each synapse (red). The modiolar and pillar side of the IHC, its apical versus basal pole, and the position of the cuticular plate are indicated. Inset shows an electron micrograph (Liberman, 1980b) of the presynaptic ribbon in an IHC, its halo of synaptic vesicles, and the postsynaptic membrane density on the terminal swelling, where GluRs are located. Approximate orientation of x-, y-, and z-planes in the subsequent confocal images is shown: images are acquired from epithelial whole mounts, viewed from the scala media surface, thus the x-axis runs into, and out of, the plane of the schematic.
Figure 2.
Figure 2.
Afferent synapses on IHCs and OHCs are seen by immunostaining presynaptic ribbons with anti-CtBP2 (red) and postsynaptic densities with anti-GluR2/3 (green). In the IHC area, most synapses include closely apposed red and green puncta (open arrows), and IHC nuclei are also weakly immunopositive for CtBP2. In the OHC area, only CtBP2-positive puncta are seen (filled arrows). A, An xy projection of a confocal z-stack through the synaptic regions of 12 IHCs and numerous OHCs from the 8 kHz region. B, a yz projection of the same z-stack. Outlines (approximate) of individual hair cells are shown by dotted white lines in A and B.
Figure 3.
Figure 3.
The opposing size gradients of presynaptic and postsynaptic elements are seen by arraying images of all the afferent synapses from five adjacent inner hair cells in exact descending order of ribbon volume, defined using a criterion brightness of 50 (of 256) in the red channel. Larger ribbons (top left) are associated with small AMPAR patches, and small ribbons (bottom right) are associated with large AMPAR patches. Each component of this composite is an xy projection of a 1.5 μm cube of voxel space centered on a different ribbon. Each ribbon from the z-stack is shown exactly once: for some thumbnails, off-center (nearby) ribbons have been erased for clarity. For display, the image array was resampled (bicubic) in Photoshop to minimize pixelization: quantification was always performed on raw image stacks. These data were obtained from the 16 kHz region.
Figure 4.
Figure 4.
A, Afferent synapses on inner hair cells show opposing spatial gradients in size of the presynaptic and postsynaptic elements: in the xy projection, synapses with the largest ribbons and smallest AMPAR patches are farthest from the OHCs (filled arrows), while those closer to the OHCs (open arrows) tend to have large AMPAR patches and small ribbons. B, In the yz projection, the largest ribbons are on the modiolar side and basal pole of the hair cell, while the largest GluR2/3 patches are on the pillar side: the approximate outline of the IHCs is shown by dotted white lines. This confocal z-stack is through the synaptic regions of four adjacent IHCs from the 14 kHz region. See text for explanation of the yellow lines in B.
Figure 5.
Figure 5.
A, B, Spatial segregation of synaptic morphologies on the sensory cell: synapses in the pillar/apical zone of the IHC have larger AMPAR patches (B) and smaller presynaptic ribbons (A) than those in the modiolar/basal region. Histograms represent data from 1243 colocalized CtBP2- and GluR2/3-positive puncta pooled from 22 confocal z-stacks from three different ears (Fig. 4 shows puncta from one z-stack). Each image stack included the synaptic poles of four to five adjacent inner hair cells. Data were obtained from all cochlear turns, from the 4 to the 55 kHz region (see Fig. 6). Inset in each panel shows the mean volume of ribbons (A) or AMPAR patches (B) for the two regions of the IHC. Error bars in the insets are SEMs computed across all ribbons or AMPAR patches. Further technical details can be found in Materials and Methods.
Figure 6.
Figure 6.
Pillar/modiolar gradient of synaptic morphologies on the sensory cell at different cochlear locations, from apical (low-frequency) to basal (high-frequency) turns. Pooled data from Figure 5 are replotted here to show each cochlear region analyzed. Each confocal z-stack produces two data points: one (red) for the ratio between the mean ribbon size on pillar/apical versus modiolar/basal zones of the cell, and one (green) for the ratio between the mean size of AMPAR patches on the two sides of the cell. Fill color indicates the level of statistical significance (unpaired Student's t test comparing the volumes from pillar/apical versus modiolar/basal sides; see key). Approximate extents of the apical and basal turns of the cochlear spiral are indicated. Further technical details can be found in Materials and Methods.
Figure 7.
Figure 7.
High-power confocal views of selected colocalized ribbons and AMPAR patches on modiolar/basal (A–E) versus pillar/apical (F–J) sides of the hair cell compared with electron microscopic reconstructions of ribbons and postsynaptic densities from identified low-SR (K, L) versus high-SR (M, N) synapses from an intracellular labeling study of cochlear nerve fibers in cat (Merchan-Perez and Liberman, 1996). Scale bar in F applies to all panels, including those from the ultrastructural study. For display purposes, these images were resampled (bicubic) in Photoshop to minimize pixelization. Quantification was always performed on raw image stacks.

References

    1. Borg E, Engström B, Linde G, Marklund K. Eighth nerve fiber firing features in normal-hearing rabbits. Hear Res. 1988;36:191–201. - PubMed
    1. Buran BN, Strenzke N, Neef A, Gundelfinger ED, Moser T, Liberman MC. Onset coding is degraded in auditory nerve fibers from mutant mice lacking synaptic ribbons. J Neurosci. 2010;30:7587–7597. - PMC - PubMed
    1. Collingridge GL, Olsen RW, Peters J, Spedding M. A nomenclature for ligand-gated ion channels. Neuropharmacology. 2009;56:2–5. - PMC - PubMed
    1. Costalupes JA, Young ED, Gibson DJ. Effects of continuous noise backgrounds on rate response of auditory nerve fibers in cat. J Neurophysiol. 1984;51:1326–1344. - PubMed
    1. Frank T, Khimich D, Neef A, Moser T. Mechanisms contributing to synaptic Ca2+ signals and their heterogeneity in hair cells. Proc Natl Acad Sci U S A. 2009;106:4483–4488. - PMC - PubMed

Publication types