. 2011 Jan 19;31(3):966-78.
doi: 10.1523/JNEUROSCI.4065-10.2011.

Axonal degeneration is mediated by the mitochondrial permeability transition pore

Affiliations

Axonal degeneration is mediated by the mitochondrial permeability transition pore

Sebastian A Barrientos et al. J Neurosci. .

Erratum in

Abstract

Axonal degeneration is an active process that has been associated with neurodegenerative conditions triggered by mechanical, metabolic, infectious, toxic, hereditary and inflammatory stimuli. This degenerative process can cause permanent loss of function, so it represents a focus for neuroprotective strategies. Several signaling pathways are implicated in axonal degeneration, but identification of an integrative mechanism for this self-destructive process has remained elusive. Here, we show that rapid axonal degeneration triggered by distinct mechanical and toxic insults is dependent on the activation of the mitochondrial permeability transition pore (mPTP). Both pharmacological and genetic targeting of cyclophilin D, a functional component of the mPTP, protects severed axons and vincristine-treated neurons from axonal degeneration in ex vivo and in vitro mouse and rat model systems. These effects were observed in axons from both the peripheral and central nervous system. Our results suggest that the mPTP is a key effector of axonal degeneration, upon which several independent signaling pathways converge. Since axonal and synapse degeneration are increasingly considered early pathological events in neurodegeneration, our work identifies a potential target for therapeutic intervention in a wide variety of conditions that lead to loss of axons and subsequent functional impairment.


Figures

Figure 1.
Figure 1.
Pharmacological inhibition of mPTP delays axonal degeneration. A, Transverse sections of nerve explants stained for NF-H (red) and NF-M (green) isoforms. The NF signals decrease considerably after 3 days (3d) in vehicle solution (Veh) and are almost completely lost by 6 days (6d). The CsA (20 μm)-treated explants show preservation of axonal proteins over 3 and 6 d in culture. Scale bar, 20 μm. B, Quantification of NF-H-positive axons in explant cross sections as shown in A, expressed as axons per 100 μm2. Statistically significant protection is seen after CsA treatment at both 3 and 6 d (n = 3 per each group; # p < 0.05 by Student's t test compared with 0 d; *p < 0.05 by Student's t test compared with 3 d vehicle; error bars indicate SEM). C, Nerve explants after different incubation times and conditions were analyzed by Western blot. Treatment with CsA delays the decrease of NF-H at 3 and 6 d compared with untreated nerves. The same effect is seen for neurofilament light (NF-L) at 3 d, but less overall protection was seen for NF-L in the 6 d incubation samples. histone H3 (His-H3) was used as a loading control. D, Densitometry of NF-H normalized to His-H3 and expressed as percentage of NF-H at day 0. Significant protection at 20 μm CsA for neurofilament decay is seen at 3 d and also at 6 d (n = 3 per each group; # p < 0.05 by Student's t test compared with 0 d; *p < 0.05 by Student's t test compared with 3 d vehicle; error bars indicate SEM). E, Transverse sections of nerve explants stained for NF-H (red) and NF-M (green). Incubation with the mPTP blockers DIDS (250 μm), R.Red (50 μm), and BAPTA-AM (100 μm) for 3 d delays axonal degeneration. Scale bar, 20 μm. F, Quantification of axons positive for NF-H in explant cross sections, expressed as axons per 100 μm2 (n = 3 per group; # p < 0.05 by Student's t test compared with 0 d; *p < 0.05 by Student's t test compared with 3 d vehicle; error bars indicate SEM). G, By Western blot analyses for NF-H, each compound appeared to delay the decay of intact NF-H in the nerve explants over 3 d incubation. H, Densitometry of NF-H normalized to His-H3 and expressed as percentage of NF-H at day 0. Significant protection of NF decay is seen at 3 d (n = 3 per group; # p < 0.05 by Student's t test compared with 0 d; *p < 0.05 by Student's t test compared with 3 d vehicle; error bars indicate SEM).
Figure 2.
Figure 2.
Rate of axonal degeneration in WT and Wlds explants and its modulation by CsA. A–C, WT (A) and Wlds (B) mouse sciatic nerves were incubated for 3, 6 and 9 d in vehicle (Veh) or CsA (20 μm). Immunostained sections were analyzed quantitatively (C). Nerve cross sections were immunostained for NF-H (red). Top row, control nerves, and below, nerves cultured for the indicated times in vehicle solution (Veh, left) or CsA (right). Scale bar, 20 μm. CsA significantly delays axonal degeneration of WT axons (A). C, Axonal density (axons per 100 μm of cross sectional area). The reduction of axonal density with time in WT nerves is impaired by CsA to a level comparable to nontreated Wlds explants. CsA do not further protect Wlds axons from injury-induced axonal degeneration up to 6 d, but significant protection is found at 9 d (n = 3 per each group; *p < 0.05 by Student's t test compared with CsA treatment in WT; error bars indicate SEM).
Figure 3.
Figure 3.
Axonal degeneration and mitochondrial swelling are delayed by CsA. Representative electron micrographs of control (A, B), CsA-treated (C), and JNK inhibitor-treated (D) wild-type sciatic nerves from explants cultured for 3 d (A–D). For comparison, representative images from distal nerve at 3 d in vivo axotomy are shown (F–K). A–D, Nerves were processed immediately for EM or after 3 d incubation in vehicle, CsA (20 μm), or the JNK inhibitor SP600125 (60 μm). Top row, WT nerves at low magnification; bottom row, corresponding mitochondria at high magnification. A, At 0 d the top shows that axons are rounded, Schmidt-Lanterman incisures are visible, and the tissue is well organized. Examples of the morphology of mitochondria from day 0 axons are shown at high magnification in the bottom. B, After incubation for 3 d in vehicle solution, the tissue is disorganized, axonal degeneration is extensive, and myelin sheaths are collapsed. In the high-magnification images at the bottom, mitochondria of axons with conserved axoplasm are clearly increased in diameter. C, After 3 d exposure to CsA, the nerve tissue is less altered compared with A, and more axons show a preserved axoplasm; the high-magnification images show mitochondria comparable those in A. D, After exposure to SP600125, the overall picture is similar to that after CsA, including the appearance of mitochondria. Scale bars: top, 10 μm; bottom, 300 nm. E, Average diameter of mitochondria in WT axons measured in EM transverse sections of axons with preserved axoplasm is shown with error bars for SEM. At 3 d of incubation, the diameter of mitochondria is 225% of the control value. This swelling is prevented substantially by CsA, the JNK inhibitor SP600125, DIDS, R.Red, and BAPTA-AM (n ≥ 45 mitochondria/nerve over 3 separate experiments; # p < 0.05 by Student's t test compared with 0 d; *p < 0.05 by Student's t test compared with 3 d vehicle). F–K, Axons undergoing degeneration in vivo display swollen mitochondria comparable to those in explants. Clusters of mitochondria are a characteristic feature of degenerating axons in explants (data not shown) and in vivo (F, G). Other abnormalities include remodeled mitochondrial cristae (H–K) and rupture of the outer mitochondrial membrane (arrow in K, which represents a higher magnification of a region in J). Accumulation of electron-dense material is usually associated with swollen mitochondria (F–I, arrowhead in I); the nature of this dense and disorganized material is not clear, but an interesting possibility is that it represents aggregated cytoskeletal proteins in the process of degeneration. Scale bars: (F, G), 1 μm; (H, J), 200 nm; (I), 300 nm. L, Mitochondrial swelling precedes axonal degeneration. Wild-type sciatic nerve explants were incubated in vehicle solution for the indicated durations. Nerve explants were fixed and processed for electron microscopy. The left y-axis shows mean mitochondrial diameter in axons (black circles, solid black line) vs Schwann cells of cross-sectioned sciatic nerves (black triangles, dashed black line), and the right y-axis shows axon degeneration expressed as percentage of degenerated axons (right y-axis, red triangles, solid red line). Axonal mitochondrial diameters but not those in the Schwann cells show a rapid increase after 6 h. In contrast, axonal degeneration is not apparent until after 24 h (n = 3 per each time point, between 30 and 100 mitochondria measured per n; error bars indicate SEM).
Figure 4.
Figure 4.
Axonal degeneration in optic nerves is delayed by CsA. Optic nerve (ON) explants from WT mice were incubated in the presence of vehicle or CsA (20 μm) for 4 d and analyzed by immunofluorescence and EM. A, Transverse sections of nerve explants stained for NF-H. After incubation of ON explants for 4 d in vehicle solution, the NF signal drops considerably. Incubation with CsA preserves the NF signals in these ON samples. Scale bar, 20 μm. B, Quantification of NF-H-positive axons in explant cross sections as shown in A, expressed as axons per 100 μm2. Statistically significant protection is seen after the CsA treatment (n = 3 per group; # p < 0.05 by Student's t test compared with 0 d; *p < 0.05 by Student's t test compared with 3 d vehicle; error bars indicates SEM). C–E, Top shows WT nerves at low magnification, and bottom shows corresponding mitochondria at high magnification. D, After incubation for 4 d in vehicle solution, the tissue is disorganized, axonal degeneration is extensive, and myelin sheaths are collapsed. The mitochondria in preserved axons are swollen (high magnification). E, Incubation with CsA protects from injury-induced axonal degeneration and mitochondrial swelling is prevented. Scale bars: top, 10 μm; bottom, 300 nm.
Figure 5.
Figure 5.
Activation of mPTP triggers degeneration of Wlds nerves. Sciatic nerve explants from Wlds mice were incubated in vehicle solution or with the mPTP activator ATR (100 μm) for 3 d and analyzed by EM and immunofluorescence. A–C, Top shows WT nerves at low magnification, and bottom show corresponding mitochondria at high magnification. B, Axons from Wlds mice do not show signs of degeneration after incubation for 3 d in vehicle solution. Mitochondria have sizes comparable to those of axonal mitochondria in explants from day 0 (A). C, After incubation for 3 d with ATR, axonal degeneration is extensive. Extensive mitochondrial swelling is seen in ATR-incubated axons (C, bottom). Scale bars: top, 10 μm; bottom, 300 nm. D, Transverse sections of nerve explants stained for NF-H (red) and NF-M (green) isoforms. In the nerve explants incubated with ATR for 3 d, the number of NF-positive axonal profiles is visibly decreased compared with the vehicle-treated nerve explants. Scale bar, 20 μm. E, Quantification of axons positive for NF-H in explant cross sections as shown in D, expressed as axons per 100 μm2. A statistically significant decrease in axonal density is seen after ATR treatment for 3 d (n = 3 per group; *p < 0.05 by Student's t test compared with 3 d vehicle; error bars indicate SEM). Lower ATR doses were also able to trigger degeneration of Wlds nerves as shown in supplemental Figure S5, available at www.jneurosci.org as supplemental material.
Figure 6.
Figure 6.
Axonal degeneration in WT and Wlds explants after mPTP activation. WT (A) and Wlds (B) mouse sciatic nerves were incubated for 1, 2, and 3 d in vehicle (Veh) or with the mPTP activator ATR (100 μm). Nerve cross sections immunostained for NF-H (red) are shown [top row, control nerves; bottom row, nerves cultured for the indicated times in vehicle solution (Veh, left) or ATR (right)]. Scale bar, 20 μm. Incubation of Wlds explants with ATR decreases the number of NF-positive axonal profiles compared with the vehicle-treated Wlds nerve explants (B, C). Note that the rate of WT axonal degeneration is not modified by ATR treatment (A, C) (n = 3 per group; *p < 0.05 by Student's t test compared with any other condition; error bars indicate SEM). D, Calcium-dependent loss of mitochondrial membrane potential (ΔΨm) is similar in purified WT and Wlds brain mitochondria. Purified WT and Wlds brain mitochondria were loaded with the membrane potential-sensitive dye TMRM. This dye accumulates inside mitochondria leading to quenching of its fluorescence. After mitochondrial depolarization, TMRM is released, leading to increase in the measured fluorescence. Thus, increase in TMRM fluorescence reflects mitochondrial depolarization. Mitochondria were incubated with 5, 50, and 100 μm calcium or vehicle. Preincubation with 5 μm CsA was used to demonstrate that the loss of ΔΨm after calcium addition is mPTP dependent. Changes in fluorescence were normalized to basal levels (precalcium or vehicle addition, scale from 0 to 1), and the values shown represent the mean fluorescence of the first 15 measurements (each separated by 43 s) after treatment with calcium or vehicle. As expected, calcium leads to a dose-dependent loss of ΔΨm (increase in TMRM fluorescence) that is inhibited by pretreatment with CsA. WT and Wlds brain mitochondria show no differences in their calcium-dependent loss of ΔΨm (n = 6 for each treatment; 3 animals per strain).
Figure 7.
Figure 7.
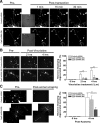
Knocking down CypD from neurons protects them from axonal degeneration. Three different approaches were used to determine whether depletion of CypD from dissociated adult DRG cultures using shRNA would protect these neurons from axonal degeneration. For this, the DRGs were transfected with CypD shRNAs (D6 and D9) vs a control nontargeting shRNA plus a vector encoding AcGFP to aid in visualizing processes. Efficacy of depletion is shown in supplemental Figure S7, available at www.jneurosci.org as supplemental material. A, Representative images of control and D9 CypD shRNAs (n = 5) before and after transection with a glass micropipette are shown in the top and bottom image sequences, respectively; the inset in the 1 min time point panel shows DIC image of the transected axon indicating the growth cone (arrowhead) and transection site (arrow). The control shRNA-transfected neurons consistently showed rapid degeneration of the distal axon after transection, but the CypD shRNA-transfected neuron showed preservation of the axon over the same time period. Similar findings were seen with D6 CypD shRNA. Scale bar, 50 μm. B, Transfected DRG cultures as in A were treated with 1 μm vincristine to induce axonal degeneration. Representative images of the AcGFP fluorescence for a single neuron over time are shown in micrographs. Quantification of axonal degeneration is shown in the graph for control, D6, and D9 CypD shRNA-transfected cultures as the average number of neurons clearly showing degeneration ± SEM (n ≥ 36 neurons analyzed for each condition over 3 separate culture experiments; ***p < 0.001 for CypD shRNA vs control shRNA for indicated times by two-way ANOVA with Bonferroni post hoc test). C, To more accurately assess the site of CypD's action, transfected DRG neurons were cultured on a porous membrane that allows for separation of axonal processes from cell bodies and non-neuronal cells (Willis et al., 2005). After 72 h culture, individual neurons were imaged and then the cell bodies and non-neuronal cells were scraped away from the upper membrane surface. The axonal trees of the same neurons were imaged 4 h later. Representative pretransection and posttransection images are shown in the micrographs. Quantification of axonal degeneration is shown in the graph as average percentage of neurons showing axonal degeneration ± SEM (n ≥ 38 and 78 neurons analyzed for each condition over 4 separate culture preparations; ***p ≤ 0.001 for CypD shRNA vs control and for D6 vs D9 CypD shRNAs by two-way ANOVA with Bonferroni post hoc test). Scale bars: (in C), B, 100 μm; C, 50 μm.
Figure 8.
Figure 8.
Model of mPTP-dependent degeneration of the axonal compartment. A, Schematic representation of neuron with soma, axon, and terminals. Mitochondria are transported along the axon by a microtubule-dependent mechanism; function of the mitochondria largely requires transport of nuclear-encoded proteins from the cell body, including proteins that seem to inhibit mPTP activation (depicted by minus sign). Defects in axonal transport (star), which could be complete (e.g., nerve transection) or partial (e.g., toxic agents, protein aggregates, or genetic disorders), disturb the physiological equilibrium between the nuclear-encoded mPTP inhibitors and locally produced activators of the mPTP. B, Proposed molecular species involved in mPTP activation and axonal degeneration. In axons, mPTP formation is inhibited by NMNAT2, which is delivered from the cell body and is a target for the proteasome in injured axons (Coleman and Freeman, 2010). Wlds mutation, CsA, and reduction of CypD expression all prevent mPTP opening. mPTP activation will lead to calcium overload in the axon, decrease in ATP production, increase in ROS generation, and liberation of prodegenarative factors, which are potentially involved in degeneration of axonal components as well as triggering further mitochondrial dysfunction.

References

    1. Araki T, Sasaki Y, Milbrandt J. Increased nuclear NAD biosynthesis and SIRT1 activation prevent axonal degeneration. Science. 2004;305:1010–1013. - PubMed
    1. Babetto E, Beirowski B, Janeckova L, Brown R, Gilley J, Thomson D, Ribchester RR, Coleman MP. Targeting NMNAT1 to axons and synapses transforms its neuroprotective potency in vivo . J Neurosci. 2010;30:13291–13304. - PMC - PubMed
    1. Baines CP, Kaiser RA, Purcell NH, Blair NS, Osinska H, Hambleton MA, Brunskill EW, Sayen MR, Gottlieb RA, Dorn GW, Robbins J, Molkentin JD. Loss of cyclophilin D reveals a critical role for mitochondrial permeability transition in cell death. Nature. 2005;434:658–662. - PubMed
    1. Beirowski B, Berek L, Adalbert R, Wagner D, Grumme DS, Addicks K, Ribchester RR, Coleman MP. Quantitative and qualitative analysis of Wallerian degeneration using restricted axonal labelling in YFP-H mice. J Neurosci Methods. 2004;134:23–35. - PubMed
    1. Beirowski B, Adalbert R, Wagner D, Grumme DS, Addicks K, Ribchester RR, Coleman MP. The progressive nature of Wallerian degeneration in wild-type and slow Wallerian degeneration (WldS) nerves. BMC Neurosci. 2005;6:6. - PMC - PubMed

Publication types

MeSH terms

Substances