. 2011 Apr;31(7):1344-56.
doi: 10.1128/MCB.01010-10. Epub 2011 Jan 19.

Identification of distal cis-regulatory elements at mouse mitoferrin loci using zebrafish transgenesis

Affiliations

Identification of distal cis-regulatory elements at mouse mitoferrin loci using zebrafish transgenesis

Julio D Amigo et al. Mol Cell Biol. 2011 Apr.

Abstract

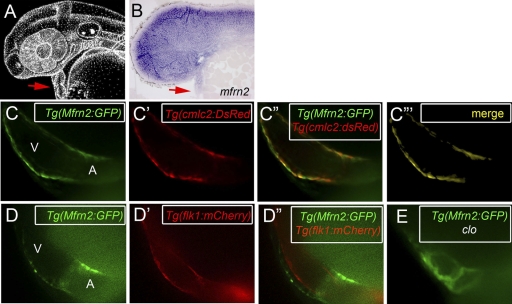
Mitoferrin 1 (Mfrn1; Slc25a37) and mitoferrin 2 (Mfrn2; Slc25a28) function as essential mitochondrial iron importers for heme and Fe/S cluster biogenesis. A genetic deficiency of Mfrn1 results in a profound hypochromic anemia in vertebrate species. To map the cis-regulatory modules (CRMs) that control expression of the Mfrn genes, we utilized genome-wide chromatin immunoprecipitation (ChIP) datasets for the major erythroid transcription factor GATA-1. We identified the CRMs that faithfully drive the expression of Mfrn1 during blood and heart development and Mfrn2 ubiquitously. Through in vivo analyses of the Mfrn-CRMs in zebrafish and mouse, we demonstrate their functional and evolutionary conservation. Using knockdowns with morpholinos and cell sorting analysis in transgenic zebrafish embryos, we show that GATA-1 directly regulates the expression of Mfrn1. Mutagenesis of individual GATA-1 binding cis elements (GBE) demonstrated that at least two of the three GBE within this CRM are functionally required for GATA-mediated transcription of Mfrn1. Furthermore, ChIP assays demonstrate switching from GATA-2 to GATA-1 at these elements during erythroid maturation. Our results provide new insights into the genetic regulation of mitochondrial function and iron homeostasis and, more generally, illustrate the utility of genome-wide ChIP analysis combined with zebrafish transgenesis for identifying long-range transcriptional enhancers that regulate tissue development.


Figures

Fig. 1.
Fig. 1.
Genome-wide analysis of ChIP-seq and ChIP-chip data predict CRMs. The Mfrn genes are plotted at the top using the base positions in mouse chromosomes (chr) 14 and 19. The coding regions are represented by the blue boxes. The intronic regions are shown as arrowheads representing the direction of transcription. The TSS is indicated by the bent arrow. The G1R-ER4/G1E inputs are represented by black boxes. The positions of the CpG islands are shown as green boxes. The regulatory-potential scores, based on a seven-species sequence alignment, are shown as blue peaks. The murine amplicons used in zebrafish and mouse transgenesis are shown as red (ChIPs) or green (CpG) rectangles above the line, with the positions of the amplicons relative to the TSS (−20.4 kb, −34.0 kb, and −37.5 kb). Three conserved core sequences for GATA-1 binding sites over the −37.5-kb CRM are shown as pink blocks. The orange numbers indicate the nucleotide positions. The image was generated from the PSU genome bioinformatics site (17).
Fig. 2.
Fig. 2.
Transgenic analysis of the murine CRMs that control the expression of the Mfrn genes in zebrafish. (A and B) Lateral views of embryos at 24 h p.f. processed by WISH showing the expression of the mfrn1 and mfrn2 transcripts. (C and D) GFP expression of the transgenic lines Tg(Mfrn1:GFP) and Tg(Mfrn2:GFP). (A and C) The mfrn1 gene is expressed in the CNS and the ICM. The GFP expression in the ICM is highlighted in the inset. (B and D) The mfrn2 gene is expressed in the CNS and myotomes (M) (magnified in the inset). The GFP expression from both transgenic lines mirrored the endogenous mRNA localization for the corresponding genes. (E to E″) Confocal fluorescence images of a double-transgenic Tg(Mfrn1:GFP)-Tg(GATA-1:DsRed) embryo showing colocalization of GFP and DsRed signals in erythroid progenitors in the ICM.
Fig. 3.
Fig. 3.
The mouse −37.5-kb CRM plus its CpG island confer specificity of GFP reporter expression in zebrafish embryos comparable to that of endogenous mfrn1 mRNA. Lateral views of zebrafish embryos at 22 (A) and 26 (B and C) h p.f. are displayed. Shown are fluorescence (A, B, and C) and bright-field merged (A′, B′, and C′) images. (A) The −20.4-kb CRM Mfrn1 transgene directs GFP reporter gene expression in the ICM (arrow). (B) The −37.5-kb CRM Mfrn1 transgene directs GFP expression in the ICM (white arrow) and CNS (yellow arrow) and promiscuously in the HG (red arrow). (C) The −37.5-kb CRM, combined with its CpG island (+CpG), restricts the GFP reporter to the ICM and CNS, thereby more faithfully reflecting its endogenous expression.
Fig. 4.
Fig. 4.
Analysis of the murine CRMs in transgenic mice. (A) The mouse Mfrn1 gene is highly expressed in the yolk sac (YS) blood islands. (B, D, and F) Transgenic-mouse embryos carrying the murine −37.5-kb CRM for the Mfrn1 gene show strong expression in the YS, as well as the hematopoietic fetal liver (FL), comparable to the endogenous Mfrn1 mRNA expression in the embryonic YS (A) and FL (C). (E and F) Higher magnifications of the transversely sectioned fetal liver from panels C and D are shown. The mouse embryonic stages are indicated in the bottom left corners.
Fig. 5.
Fig. 5.
GATA-1 and FOG-1 bind Mfrn1 CRM sites in vivo. (A) The relative occupancy levels of GATA-2, GATA-1, and FOG-1 from ChIP analysis with G1ER cells are indicated by the fold enrichment at each site, normalized to levels in the negative-control region (a 2-kb fragment upstream of the GATA-1 gene enhancer hypersensitive site 1 [HS1]). The bar graphs represent quantification of the ChIP analyses (means + SD from 3 independent experiments). The addition of estradiol to G1ER cells activates GATA-1 and triggers erythroid maturation (uninduced [U] and induced [I]). The asterisks indicate the changes of significance in GATA-2, GATA-1, and FOG-1 occupancy at the −20.4-kb and −37.5-kb CRMs in the Mfrn1 locus compared to the serum control (*, P < 0.05). (B) The relative occupancy levels of GATA-1 and FOG-1 from ChIP analysis of differentiated (DMSO-induced) MEL cells are indicated by the fold enrichment at the −20.4-kb and −37.5-kb CRM sites (*, P < 0.05).
Fig. 6.
Fig. 6.
GBE sites are functionally necessary for GATA-1-mediated transactivation of the −37.5-kb CRM enhancer. (A) A −37.5-kb CRM containing three putative GBE sites (GBE1 to -3) was constructed to drive expression of a GFP reporter. The GATA-binding core sequence in each of the three GBE was mutagenized (GATA→CTTA) singly or in combination, as indicated by “X,” and labeled M1, M2, or M3 for the respective GBE. Reporter plasmids with two mutated GBE are labeled accordingly. The GFP expression in transgenic zebrafish embryos injected with either wild-type or mutant constructs at the one-cell stage is quantified at the right of the corresponding construct. (B to B″) Embryos injected with the various GBE constructs were placed in three different categories, depending on the level of GFP expression: normal, reduced, and absent. (C to P) Lateral views of representative embryos injected with GBE control (wt) or mutant constructs are shown at 24 h p.f. The images on the left are merged bright-field and fluorescence images. The images on the right are fluorescence images. Higher-magnification views of the ICM are shown in the insets.
Fig. 7.
Fig. 7.
Mfrn1 expression pattern during early erythropoiesis. Dorsal and lateral views of embryos at the 15-, 17-, and 20-somite stages (the vertical arrow indicates the anterior-posterior axis; the horizontal arrows indicate the rostral-caudal axis). The zygotic expression pattern of mfrn1 is coincident with the expression of GATA-1, FOG-1, GATA-2, scl, and lmo2 in the LPM and ICM (arrowheads).
Fig. 8.
Fig. 8.
GATA-1 and FOG-1 regulate the expression of Mfrn1 during erythropoiesis. (A) The GATA-1 morphants show normal scl and lmo2 expression in hematopoietic progenitors; in contrast, the loss of either GATA-1 or FOG-1 results in the loss of mfrn1 expression in the LPM and ICM. Loss of GATA-2 function does not affect mfrn1 expression. The numbers of morphants with expression of the hematopoietic marker and total numbers of injected embryos are displayed in the right upper corners. (B) Lateral views at 22 h p.f. of Tg(Mfrn1:GFP) embryos uninjected or injected with GATA-1 MO. The arrowheads denote GFP expression in the ICM (highlighted in the insets). (C) The GFP+ cells from Tg(Mfrn1:GFP) embryos were purified by flow cytometry. Quantitative analysis of sorted cells from GATA-1 morphants (GATA-1 MO) shows a reduction in the number of GFP+ cells compared with control Tg(Mfrn1:GFP) embryos. (D) Model for Mfrn1 regulation by GATA factors. Initially, the Mfrn1-CRM is occupied by GATA-2, which does not activate Mfrn1 transcription. After the level of GATA-1 reaches a certain threshold level, GATA-1 binds the Mfrn1-CRM, together with FOG-1, displacing GATA-2 and activating the expression of Mfrn1 during erythroid maturation.
Fig. 9.
Fig. 9.
The transgenic Tg(Mfrn1:GFP) expresses the GFP reporter in the myocardium. (A and B) Lateral views of zebrafish embryos at 48 h p.f. (A) Schematic representation of the zebrafish embryo (http://www.zfin.org). (B) WISH of mfrn1 in embryonic sections showing its expression in the heart (H; red arrow), kidney, a hematopoietic tissue in teleosts (K; red arrowhead), and the midbrain-hindbrain boundary (asterisk). (C and D) By 48 h p.f., cardiac chambers (atrium [A] and ventricle [V]) and two layers (myocardium [green] and endocardium [red]) form. (E to E‴) Merged confocal images of a double-transgenic Tg(Mfrn1:GFP)-Tg(cmlc2:DsRed) embryo reveal colocalized expression of mfrn1 in the myocardial layer (yellow). (F to F″) Merged confocal images of a double-transgenic Tg(Mfrn1:GFP)-Tg(flk1:mCherry) embryo suggest that Mfrn1 is not expressed in the endothelial cell layer. (G) GFP expression for transgenic Tg(Mfrn1:GFP) in cloche indicates that mfrn1 is expressed in the myocardium. (H and I) Bright-field and fluorescence images of the transgenic Tg(Mfrn1:GFP) mouse embryo at E12.5 showing expression of the GFP reporter in the heart (H; arrows) and liver (L; arrowheads). (J to L) LacZ reporter expression from an Mfrn1 gene trap transgenic mouse at embryonic stages E12.5 to E14, confirming endogenous Mfrn1 expression (blue) in the atria (A) and ventricles (V).
Fig. 10.
Fig. 10.
The transgenic Tg(Mfrn2:GFP) expresses the GFP reporter in the myocardium. (A and B) Lateral views of zebrafish embryos at 48 h p.f. (A) Schematic representation of the zebrafish embryo (http://www.zfin.org). (B) WISH of mfrn2 in sectioned embryos showing expression in the heart (red arrow). (C and C′) Confocal fluorescence images showing the transgenic Tg(Mfrn2:GFP) expression in the heart (green) (C) and the transgenic Tg(cmlc2:DsRed) marker in the myocardium (red) (C′). (C″ and C‴) Merged confocal images of a double-transgenic Tg(Mfrn2:GFP)-Tg(cmlc2:DsRed) embryo reveal colocalized expression of Mfrn2 in the myocardial layer (yellow). (D and D′) Confocal images of the transgenic Tg(Mfrn2:GFP) (green) (D) and the endocardium-specific transgenic Tg(flk1:mCherry) (red) (D′). (D″) Merged confocal images in a double-transgenic Tg(Mfrn2:GFP)-Tg(flk1:mCherry) embryo indicate Mfrn2 is not expressed in the endothelial-cell layer. (E) Confocal microscopy of transgenic Tg(Mfrn2:GFP) in the endocardium-deficient mutant (clo) show GFP expression, supporting the idea that Mfrn2 is specifically expressed in the myocardium.

References

    1. Amigo J. D., et al. 2009. The role and regulation of friend of GATA-1 (FOG-1) during blood development in the zebrafish. Blood 114:4654–4663 - PMC - PubMed
    1. Andrews N. C. 2008. Forging a field: the golden age of iron biology. Blood 112:219–230 - PMC - PubMed
    1. Anguita E., et al. 2004. Globin gene activation during haemopoiesis is driven by protein complexes nucleated by GATA-1 and GATA-2. EMBO J. 23:2841–2852 - PMC - PubMed
    1. Antequera F. 2003. Structure, function and evolution of CpG island promoters. Cell. Mol. Life Sci. 60:1647–1658 - PMC - PubMed
    1. Bajic V. B., Tan S. L., Suzuki Y., Sugano S. 2004. Promoter prediction analysis on the whole human genome. Nat. Biotechnol. 22:1467–1473 - PubMed

Publication types

MeSH terms

LinkOut - more resources