

Quantification of hepatic steatosis with T1-independent, T2-corrected MR imaging with spectral modeling of fat: blinded comparison with MR spectroscopy
- PMID: 21248233
- PMCID: PMC3042638
- DOI: 10.1148/radiol.10100708
Quantification of hepatic steatosis with T1-independent, T2-corrected MR imaging with spectral modeling of fat: blinded comparison with MR spectroscopy
Abstract
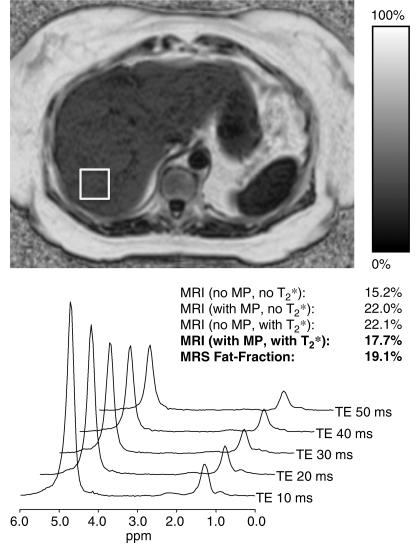
Purpose: To prospectively compare an investigational version of a complex-based chemical shift-based fat fraction magnetic resonance (MR) imaging method with MR spectroscopy for the quantification of hepatic steatosis.
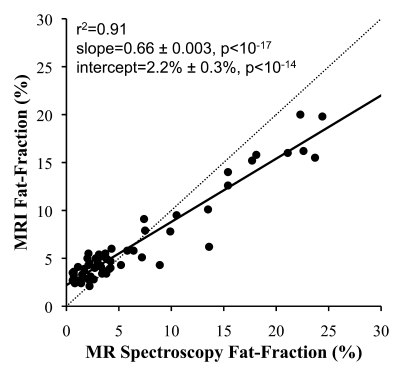
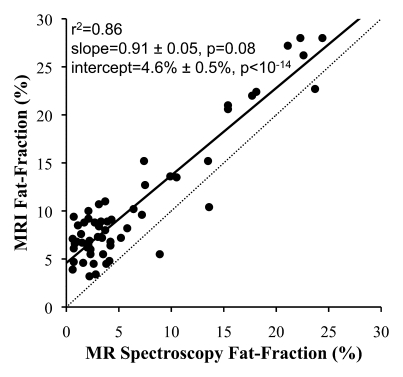
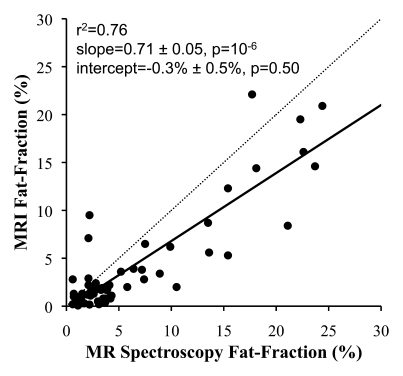
Materials and methods: This study was approved by the institutional review board and was HIPAA compliant. Written informed consent was obtained before all studies. Fifty-five patients (31 women, 24 men; age range, 24-71 years) were prospectively imaged at 1.5 T with quantitative MR imaging and single-voxel MR spectroscopy, each within a single breath hold. The effects of T2 correction, spectral modeling of fat, and magnitude fitting for eddy current correction on fat quantification with MR imaging were investigated by reconstructing fat fraction images from the same source data with different combinations of error correction. Single-voxel T2-corrected MR spectroscopy was used to measure fat fraction and served as the reference standard. All MR spectroscopy data were postprocessed at a separate institution by an MR physicist who was blinded to MR imaging results. Fat fractions measured with MR imaging and MR spectroscopy were compared statistically to determine the correlation (r(2)), and the slope and intercept as measures of agreement between MR imaging and MR spectroscopy fat fraction measurements, to determine whether MR imaging can help quantify fat, and examine the importance of T2 correction, spectral modeling of fat, and eddy current correction. Two-sided t tests (significance level, P = .05) were used to determine whether estimated slopes and intercepts were significantly different from 1.0 and 0.0, respectively. Sensitivity and specificity for the classification of clinically significant steatosis were evaluated.
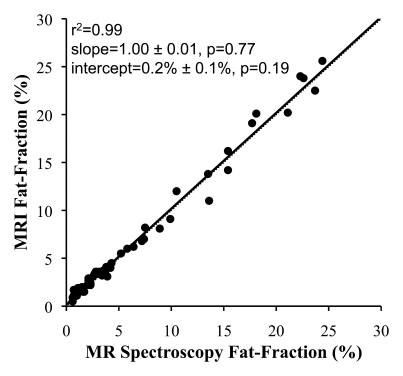
Results: Overall, there was excellent correlation between MR imaging and MR spectroscopy for all reconstruction combinations. However, agreement was only achieved when T2 correction, spectral modeling of fat, and magnitude fitting for eddy current correction were used (r(2) = 0.99; slope ± standard deviation = 1.00 ± 0.01, P = .77; intercept ± standard deviation = 0.2% ± 0.1, P = .19).
Conclusion: T1-independent chemical shift-based water-fat separation MR imaging methods can accurately quantify fat over the entire liver, by using MR spectroscopy as the reference standard, when T2 correction, spectral modeling of fat, and eddy current correction methods are used.
© RSNA, 2011.
Figures
References
-
- Yki-Järvinen H. Fat in the liver and insulin resistance. Ann Med 2005;37(5):347–356 - PubMed
-
- Browning JD, Szczepaniak LS, Dobbins R, et al. Prevalence of hepatic steatosis in an urban population in the United States: impact of ethnicity. Hepatology 2004;40(6):1387–1395 - PubMed
-
- Ogden CL, Carroll MD, Curtin LR, McDowell MA, Tabak CJ, Flegal KM. Prevalence of overweight and obesity in the United States, 1999–2004. JAMA 2006;295(13):1549–1555 - PubMed
-
- Rashid M, Roberts EA. Nonalcoholic steatohepatitis in children. J Pediatr Gastroenterol Nutr 2000;30(1):48–53 - PubMed
-
- Schwimmer JB. Definitive diagnosis and assessment of risk for nonalcoholic fatty liver disease in children and adolescents. Semin Liver Dis 2007;27(3):312–318 - PubMed
Publication types
MeSH terms
Substances
Grants and funding
LinkOut - more resources
Full Text Sources
Other Literature Sources
Medical
