Coalescent histories on phylogenetic networks and detection of hybridization despite incomplete lineage sorting
- PMID: 21248369
- PMCID: PMC3167682
- DOI: 10.1093/sysbio/syq084
Coalescent histories on phylogenetic networks and detection of hybridization despite incomplete lineage sorting
Abstract
Analyses of the increasingly available genomic data continue to reveal the extent of hybridization and its role in the evolutionary diversification of various groups of species. We show, through extensive coalescent-based simulations of multilocus data sets on phylogenetic networks, how divergence times before and after hybridization events can result in incomplete lineage sorting with gene tree incongruence signatures identical to those exhibited by hybridization. Evolutionary analysis of such data under the assumption of a species tree model can miss all hybridization events, whereas analysis under the assumption of a species network model would grossly overestimate hybridization events. These issues necessitate a paradigm shift in evolutionary analysis under these scenarios, from a model that assumes a priori a single source of gene tree incongruence to one that integrates multiple sources in a unifying framework. We propose a framework of coalescence within the branches of a phylogenetic network and show how this framework can be used to detect hybridization despite incomplete lineage sorting. We apply the model to simulated data and show that the signature of hybridization can be revealed as long as the interval between the divergence times of the species involved in hybridization is not too small. We reanalyze a data set of 106 loci from 7 in-group Saccharomyces species for which a species tree with no hybridization has been reported in the literature. Our analysis supports the hypothesis that hybridization occurred during the evolution of this group, explaining a large amount of the incongruence in the data. Our findings show that an integrative approach to gene tree incongruence and its reconciliation is needed. Our framework will help in systematically analyzing genomic data for the occurrence of hybridization and elucidating its evolutionary role.
Figures


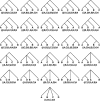
 in Equation (3)) from true gene trees. The variance of the estimates is lower than 0.001 in most cases, and reaches a maximum value of 0.008.4
 in Equation (3)) from reconstructed gene trees. The variance of the estimates is lower than 0.001 in most cases, and reaches a maximum value of 0.008.

References
-
- Arnold ML. Natural hybridization and evolution. Oxford: Oxford University Press; 1997.
-
- Cranston KA, Hurwitz B, Ware D, Stein L, Wing RA. Species trees from highly incongruent gene trees in rice. Syst. Biol. 2009;58:489–500. - PubMed
-
- Degnan JH, Rosenberg NA. Gene tree discordance, phylogenetic inference and the multispecies coalescent. Trends Ecol. Evol. 2009;24:332–340. - PubMed
-
- Degnan JH, Salter LA. Gene tree distributions under the coalescent process. Evolution. 2005;59:24–37. - PubMed
Publication types
MeSH terms
Grants and funding
LinkOut - more resources
Full Text Sources
Molecular Biology Databases

