. 2011 May;19(5):561-6.
doi: 10.1038/ejhg.2010.229. Epub 2011 Jan 19.

HTT haplotypes contribute to differences in Huntington disease prevalence between Europe and East Asia

Affiliations

HTT haplotypes contribute to differences in Huntington disease prevalence between Europe and East Asia

Simon C Warby et al. Eur J Hum Genet. 2011 May.

Abstract

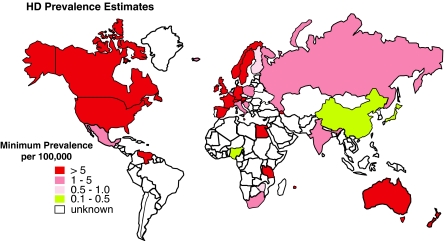
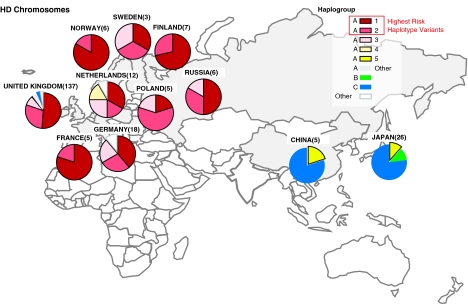
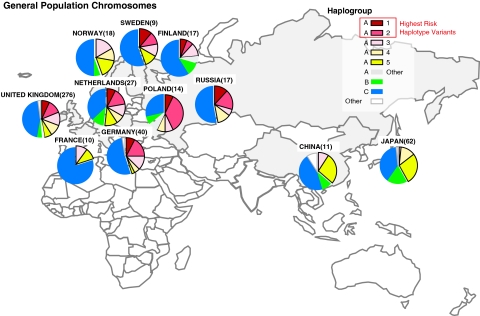
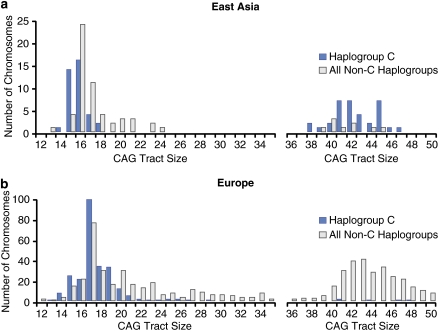
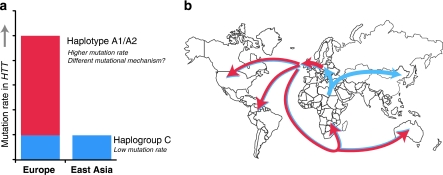
Huntington disease (HD) results from CAG expansion in the huntingtin (HTT) gene. Although HD occurs worldwide, there are large geographic differences in its prevalence. The prevalence in populations derived from Europe is 10-100 times greater than in East Asia. The European general population chromosomes can be grouped into three major haplogroups (group of similar haplotypes): A, B and C. The majority of HD chromosomes in Europe are found on haplogroup A. However, in the East-Asian populations of China and Japan, we find the majority of HD chromosomes are associated with haplogroup C. The highest risk HD haplotypes (A1 and A2), are absent from the general and HD populations of China and Japan, and therefore provide an explanation for why HD prevalence is low in East Asia. Interestingly, both East-Asian and European populations share a similar low level of HD on haplogroup C. Our data are consistent with the hypothesis that different HTT haplotypes have different mutation rates, and geographic differences in HTT haplotypes explain the difference in HD prevalence. Further, the bias for expansion on haplogroup C in the East-Asian population cannot be explained by a higher average CAG size, as haplogroup C has a lower average CAG size in the general East-Asian population compared with other haplogroups. This finding suggests that CAG-tract size is not the only factor important for CAG instability. Instead, the expansion bias may be because of genetic cis-elements within the haplotype that influence CAG instability in HTT, possibly through different mutational mechanisms for the different haplogroups.


Figures

Figure 1
Figure 1
Worldwide estimates of the prevalence of HD. Overall, the prevalence of HD is much higher in European populations than in East Asia. Average minimum prevalence on the basis of several studies are shown (references in Supplementary Table 1). Note that prevalence studies occurring before the discovery of the HD gene in 1993 could underestimate the true prevalence of HD by as much as 14–24%., In particular, many of the studies in Africa have small sample sizes and the HD diagnosis has not confirmed by molecular testing. As HD phenocopy disorders are relatively common in Africa, these studies could have significantly overestimated the HD prevalence in these regions. Currently, the Maracaibo region of Venezuela has the highest reported worldwide prevalence of HD (700 per 1 00 000). Venezuela was colonized by the Spanish in the 16th century, and the origins of HD in Venezuela can be traced back to Europe. Also see Harper, Conneally and Al Jader et al for earlier reviews on the worldwide prevalence of HD.
Figure 2
Figure 2
HTT haplogroups of CAG-expanded chromosomes (>35CAG). The HD mutation occurs on different haplogroups in East-Asian and European populations. In Europe, CAG expansion is most likely to be found on haplogroup A, particularly variants A1 and A2. In East Asia, CAG expansion is associated with different haplogroups, including haplogroup C. Note that ‘Other' haplotypes (white) could not be easily categorized into haplogroup A, B or C. ‘A-Other' haplogroup variants (grey) could not be easily categorized into a variant of haplogroup A. Number of chromosomes are indicated in brackets. The data are also presented in Supplementary Table 3.
Figure 3
Figure 3
HTT haplogroups of the general population (<27CAG). There is a diversity of haplogroups found in the general population of Europe, despite the fact that CAG expansion is most likely to occur on haplogroup A in this population (compare with Figure 2). Note that haplogroup A, and the variants with the highest risk of CAG expansion in the European population (A1 and A2, in red) are absent from the general population of China and Japan. Number of chromosomes are indicated in brackets. The data are also presented in Supplementary Table 3.
Figure 4
Figure 4
CAG size distributions of haplogroup C (a) East Asia and (b) Europe. In East Asia, the majority of HD mutations occur on haplogroup C. In the general population of East Asia, the average CAG-tract size of haplogroup C is less than other haplogroups, suggesting that the bias of expansion is not simply because of a large average CAG-tract size (Note that the CAG-tract size distribution is discontinuous because of the fact that there is an ascertainment bias towards discovering chromosomes with >36CAG due to HD symptoms).
Figure 5
Figure 5
Model of CAG expansion in HTT. (a) At least two mutation rates and potentially two mutational mechanisms, may contribute to CAG expansion in HTT. The low prevalence of HD on haplogroup C is consistent in both East-Asian and European populations and is explained by a low level of CAG expansion that occurs on haplogroup C (blue). The mutation rate of the second mechanism (red) is much higher and therefore results in a higher overall prevalence of HD in European populations. (b) The genetic changes that produced haplotypes A1/A2 appear to have occurred after the separation of Asian and European chromosomes (red arrows), as these haplotypes are completely absent from the Chinese and Japanese populations. The genetic changes that produced A1/A2 may have altered cis-elements in and around the HTT gene, resulting in a higher rate of CAG-expansion. Chromosomes from Europe serve as the origin of HD in several other populations including North and South America, South Africa and Australia through human migration.

References

    1. Walker FO. Huntington's disease. Lancet. 2007;369:218–228. - PubMed
    1. Al-Jader LN, Harper PS, Krawczak M, Palmer SR. The frequency of inherited disorders database: prevalence of Huntington disease. Community Genet. 2001;4:148–157. - PubMed
    1. Andrew SE, Hayden MR. Origins and evolution of Huntington disease chromosomes. Neurodegeneration. 1995;4:239–244. - PubMed
    1. Harper PS. The epidemiology of Huntington's disease. Hum Genet. 1992;89:365–376. - PubMed
    1. Squitieri F, Andrew SE, Goldberg YP, et al. DNA haplotype analysis of Huntington disease reveals clues to the origins and mechanisms of CAG expansion and reasons for geographic variations of prevalence. Hum Mol Genet. 1994;3:2103–2114. - PubMed

Publication types