. 2011 Jan 20:12:6.
doi: 10.1186/1471-2172-12-6.

Persistence of virus-specific immune responses in the central nervous system of mice after West Nile virus infection

Affiliations

Persistence of virus-specific immune responses in the central nervous system of mice after West Nile virus infection

Barbara S Stewart et al. BMC Immunol. .

Abstract

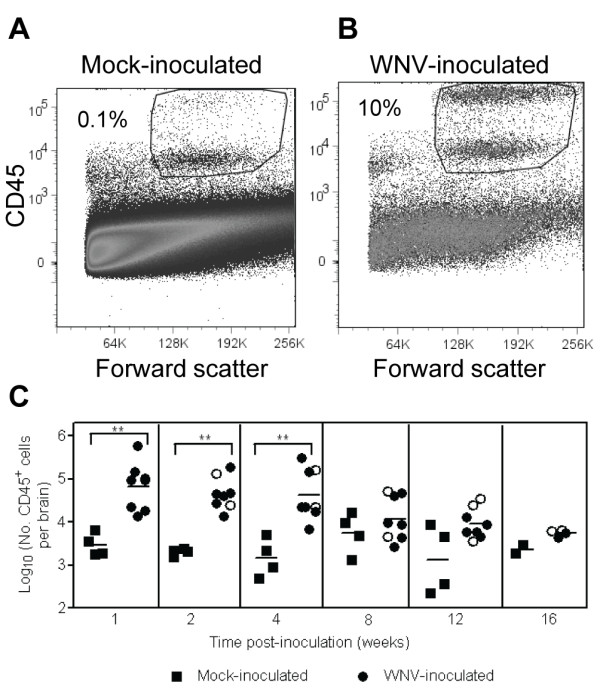
Background: West Nile virus (WNV) persists in humans and several animal models. We previously demonstrated that WNV persists in the central nervous system (CNS) of mice for up to 6 months post-inoculation. We hypothesized that the CNS immune response is ineffective in clearing the virus.

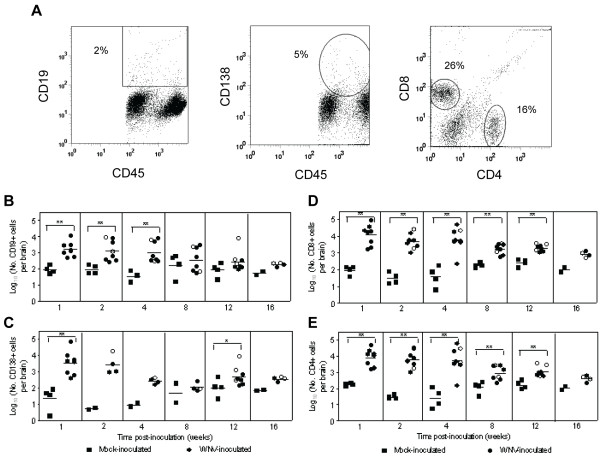
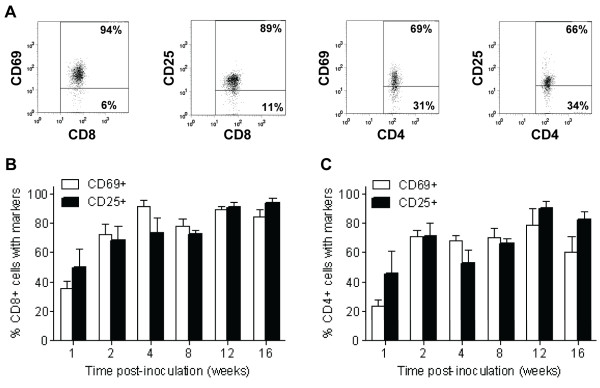
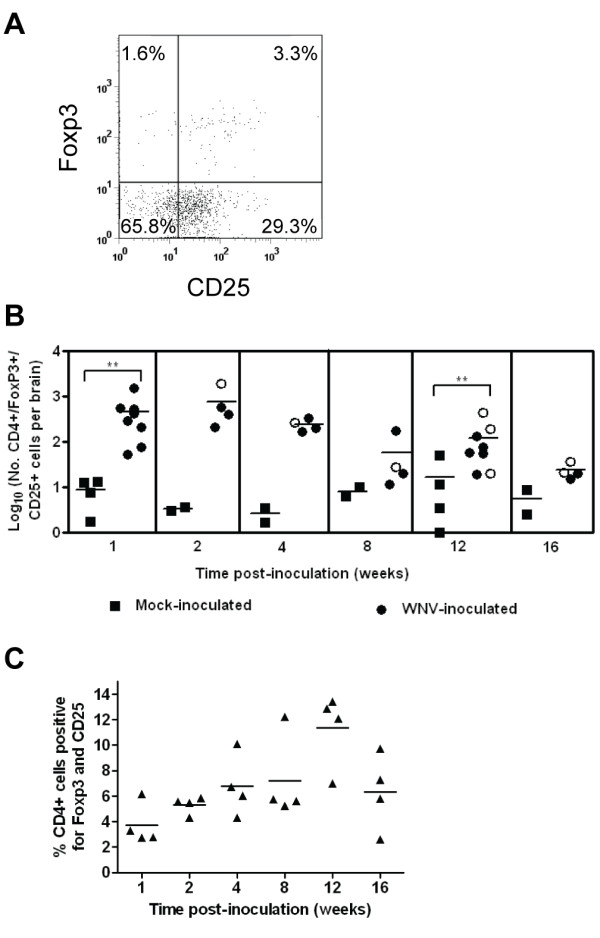
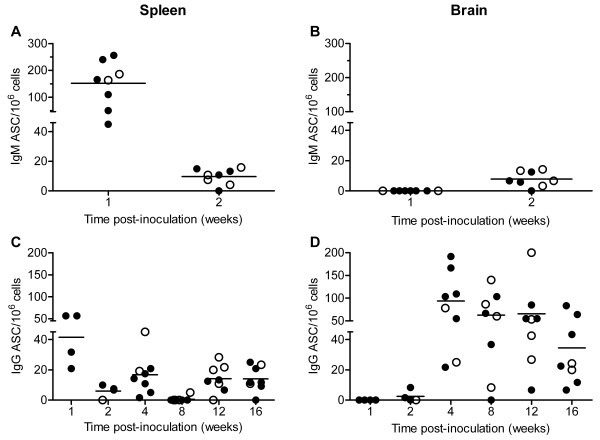
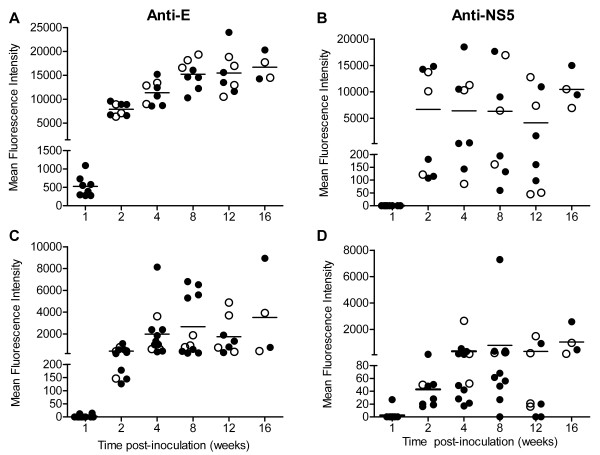
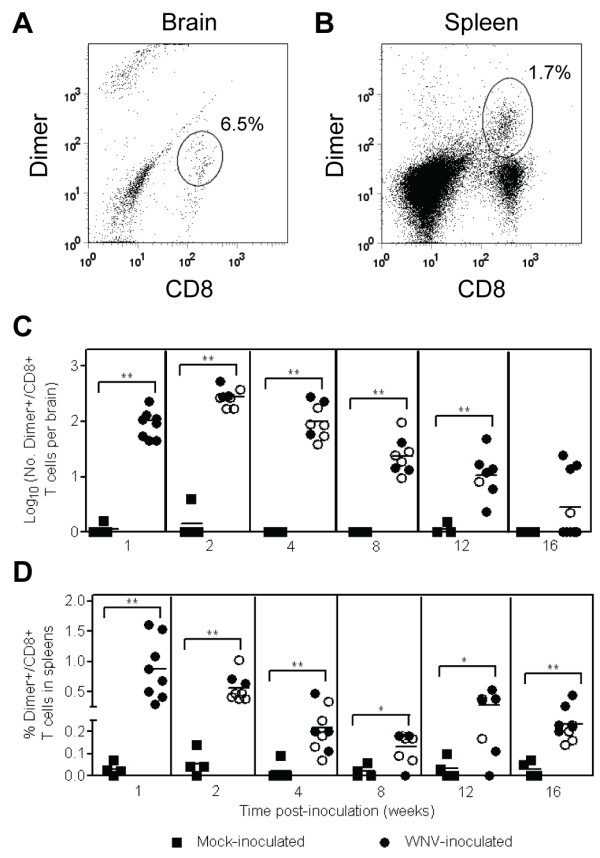
Results: Immunocompetent, adult mice were inoculated subcutaneously with WNV, and the CNS immune response was examined at 1, 2, 4, 8, 12 and 16 weeks post-inoculation (wpi). Characterization of lymphocyte phenotypes in the CNS revealed elevation of CD19+ B cells for 4 wpi, CD138 plasma cells at 12 wpi, and CD4+ and CD8+ T cells for at least 12 wpi. T cells recruited to the brain were activated, and regulatory T cells (Tregs) were present for at least 12 wpi. WNV-specific antibody secreting cells were detected in the brain from 2 to 16 wpi, and virus-specific CD8+ T cells directed against an immunodominant WNV epitope were detected in the brain from 1 to 16 wpi. Furthermore, these WNV-specific immune responses occurred in mice with and without acute clinical disease.

Conclusions: Virus-specific immune cells persist in the CNS of mice after WNV infection for up to 16 wpi.


Figures

Figure 1
Figure 1
WNV infection induces leukocyte infiltration in the CNS. Adult, female B6 mice were inoculated SC with diluent (mock) or 103 PFU of WNV in the left rear footpad. At various times post-inoculation, two mock-inoculated and four WNV-inoculated mice were sacrificed and perfused with perfusion buffer. CNS mononuclear cells were collected, and flow cytometry was performed for various cell markers. Representative scatter plots and gating for flow cytometry are shown for leukocytes isolated from brains of (A) a mock-inoculated mouse and (B) a WNV-inoculated mouse. (C) Numbers of CD45+ cells are reported per brain. Each data point represents an individual mouse, and solid horizontal lines represent the geometric means. Open symbols indicate mice that showed clinical signs of disease during acute illness. Two independent studies were performed for 1, 2, 4, 8 and 12 wpi, and these data were analyzed by Mann-Whitney U tests with P values indicated by: 0.001 < ** ≤0.01.
Figure 2
Figure 2
B cells and T cells persist in the CNS of WNV-inoculated mice. Adult, female B6 mice were inoculated SC with diluent (mock) or 103 PFU of WNV in the left rear footpad. At various times post-inoculation, two mock-inoculated and four WNV-inoculated mice were sacrificed and perfused with perfusion buffer. CNS mononuclear cells were collected, and flow cytometry was performed for various cell markers. Cells were gated on the CD45+ population as shown in Figure 1. (A) Representative scatter plots are shown for CD19+, CD138+, CD4+ and CD8+ cells from WNV-inoculated mice. The numbers of (B) CD19+, (C) CD138+, (D) CD8+, and (E) CD4+ cells per brain are shown at various times post-inoculation. Each data point represents an individual mouse, and solid horizontal lines represent the geometric means. Open symbols indicate mice that showed clinical signs of disease during acute illness. Two independent studies were performed for 1, 2, 4, 8 and 12 wpi for B, D and E and for 1 and 12 wpi for C, and these data were analyzed by Mann-Whitney U tests with P values indicated by: 0.001 < ** ≤0.01 and 0.01 < * ≤0.05.
Figure 3
Figure 3
T cells are activated in the CNS of WNV-inoculated mice. Adult, female B6 mice were inoculated SC with 103 PFU of WNV in the left rear footpad. At various times post-inoculation, four WNV-inoculated mice were sacrificed and perfused with perfusion buffer. CNS mononuclear cells were collected, and flow cytometry was performed for various cell markers. Cells were gated on the CD45+ population as shown in Figure 1. (A) Representative scatter plots are shown for activation markers, CD69 or CD25, on cells gated for the CD4+ or CD8+ population from WNV-inoculated mice. The percentage of (B) CD8+ T cells and (C) CD4+ T cells expressing either CD69 or CD25 in the brains of WNV-inoculated mice are shown at various times post-inoculation. Bars and error bars represent the average and SD of four mice.
Figure 4
Figure 4
Tregs are present in the CNS of WNV-inoculated mice. Adult, female B6 mice were inoculated SC with diluent (mock) or 103 PFU of WNV in the left rear footpad. At various times post-inoculation, two mock-inoculated and four WNV-inoculated mice were sacrificed and perfused with perfusion buffer. CNS mononuclear cells were collected, and flow cytometry was performed for various cell markers. Cells were gated on the CD45+ population as shown in Figure 1. (A) Representative scatter plot is shown for Treg markers, Foxp3 and CD25, on cells gated for the CD4+ population from a WNV-inoculated mouse. (B) The numbers of CD4+/Foxp3+/CD25+ cells per brain are shown at various times post-inoculation. Each data point represents an individual mouse, and solid horizontal lines represent the geometric means. Open symbols indicate mice that showed clinical signs of disease during acute illness. The data point on the x-axis is negative. Two independent studies were performed for 1 and 12 wpi, and these data were analyzed by Mann-Whitney U tests with P values indicated by: 0.001 < ** ≤0.01. (C) The percentage of CD4+ cells expressing Foxp3 and CD25 in the brains of WNV-inoculated mice is shown at various times post-inoculation. Each data point represents an individual mouse, and solid horizontal lines represent the means. The groups from each time point were significantly different by a Kruskal-Wallis test (P = 0.05), and the group at 12 wpi was significantly different from the groups at 1, 2 and 4 wpi by Mann-Whitney U tests (P < 0.05).
Figure 5
Figure 5
WNV-specific ASC persist in brains for at least 16 wpi in WNV-inoculated mice. Adult, female B6 mice were inoculated SC with diluent (mock) or 103 PFU of WNV in the left rear footpad. At various times post-inoculation, two mock-inoculated and four WNV-inoculated mice were sacrificed and perfused with perfusion buffer. Brain and splenic mononuclear cells were collected, and ELISPOT assays for ASC were performed using WNV and irrelevant antigens. The numbers of IgM ASC in the (A) spleen and (B) brain and the numbers of IgG ASC in the (C) spleen and (D) brain are reported. Each data point represents a single mouse, and solid horizontal lines represent the means. Open symbols indicate mice that displayed signs of clinical disease during the acute illness. Data points on the x-axis are negative. Data are from one to two independent studies. Results from mock-inoculated mice were negative and are not shown.
Figure 6
Figure 6
WNV-specific antibodies are present in brains for at least 16 wpi in WNV-inoculated mice. Adult, female B6 mice were inoculated SC with diluent (mock) or 103 PFU of WNV in the left rear footpad. At various time points post-inoculation, two mock-inoculated and four WNV-inoculated mice were sacrificed and perfused with perfusion buffer. (Aand B) Sera and (Cand D) supernatant from homogenized brain were tested for antibodies against (Aand C) WNV E and (Band D) WNV NS5 proteins using MIA. Each data point represents an individual mouse, and solid horizontal lines represent the means. Open symbols indicate mice that displayed signs of clinical disease during the acute illness. Data points on the x-axis are negative. Data are from one to two independent studies. Results from mock-inoculated mice were negative and are not shown.
Figure 7
Figure 7
WNV-specific CD8+ T cells persist in brains for up to 16 wpi in WNV-inoculated mice. Adult, female B6 mice were inoculated SC with diluent (mock) or 103 PFU of WNV in the left rear footpad. At various times post-inoculation, two mock-inoculated and four WNV-inoculated mice were sacrificed and perfused with perfusion buffer. CNS and splenic mononuclear cells were collected, and flow cytometry was performed for CD45, CD8 and MHC class I dimer for a WNV dominant epitope (SSVWNATTA) and an irrelevant epitope. Cells were gated on the CD45+ population as shown in Figure 1. Representative scatter plots are shown for CD8 and WNV-specific dimer in the (A) brain and (B) spleen from WNV-inoculated mice. The numbers of CD8+ T cells in the (C) brain and the percentages of CD8+ T cells in the (D) spleen that were specific for the WNV epitope are reported. Values for specific CD8+ T cells were calculated by subtracting background values for the irrelevant peptide from values for the WNV peptide. Each data point represents an individual mouse, and solid horizontal lines represent the geometric means in (C) and means in (D). Open symbols indicate mice that displayed signs of disease during acute illness. Data points on the x-axis are negative. Two independent studies were performed, and these data were analyzed by Mann-Whitney U tests with P values indicated by: 0.001 < ** ≤0.01 and 0.01 < * ≤0.05.

References

    1. Petersen LR, Roehrig JT, Hughes JM. West Nile virus encephalitis. N Engl J Med. 2002;347:1225–1226. doi: 10.1056/NEJMo020128. - DOI - PubMed
    1. Bode AV, Sejvar JJ, Pape WJ, Campbell GL, Marfin AA. West Nile virus disease: a descriptive study of 228 patients hospitalized in a 4-county region of Colorado in 2003. Clin Infect Dis. 2006;42:1234–1240. doi: 10.1086/503038. - DOI - PubMed
    1. Sejvar JJ, Haddad MB, Tierney BC, Campbell GL, Marfin AA, Van Gerpen JA, Fleischauer A, Leis AA, Stokic DS, Petersen LR. Neurologic manifestations and outcome of West Nile virus infection. JAMA. 2003;290:511–515. doi: 10.1001/jama.290.4.511. - DOI - PubMed
    1. Weiss D, Carr D, Kellachan J, Tan C, Phillips M, Bresnitz E, Layton M. Clinical findings of West Nile virus infection in hospitalized patients, New York and New Jersey, 2000. Emerg Infect Dis. 2001;7:654–658. doi: 10.3201/eid0704.010409. - DOI - PMC - PubMed
    1. Carson PJ, Konewko P, Wold KS, Mariani P, Goli S, Bergloff P, Crosby RD. Long-term clinical and neuropsychological outcomes of West Nile virus infection. Clin Infect Dis. 2006;43:723–730. doi: 10.1086/506939. - DOI - PubMed

Publication types

MeSH terms

Substances