

Epidemiology and trends for Caesarean section births in New South Wales, Australia: a population-based study
- PMID: 21251270
- PMCID: PMC3037931
- DOI: 10.1186/1471-2393-11-8
Epidemiology and trends for Caesarean section births in New South Wales, Australia: a population-based study
Abstract
Background: Caesarean section (CS) rates around the world have been increasing and in Australia have reached 30% of all births. Robson's Ten-Group Classification System (10-group classification) provides a clinically relevant classification of CS rates that provides a useful basis for international comparisons and trend analyses. This study aimed to investigate trends in CS rates in New South Wales (NSW), including trends in the components of the 10-group classification.
Methods: We undertook a cross-sectional study using data from the Midwives Data Collection, a state-wide surveillance system that monitors patterns of pregnancy care, services and pregnancy outcomes in New South Wales, Australia. The study population included all women giving birth between 1st January 1998 and 31st December 2008. Descriptive statistics are presented including age-standardised CS rates, annual percentage change as well as regression analyses.
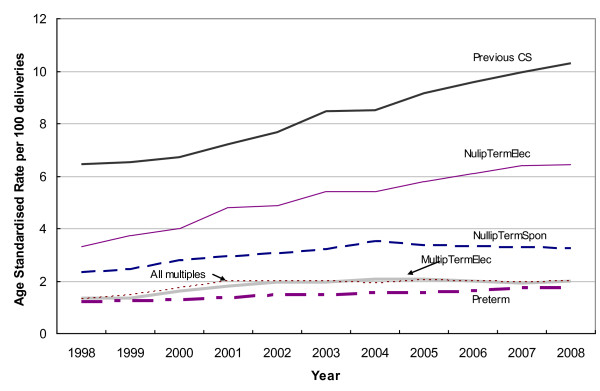
Results: From 1998 to 2008 the CS rate in NSW increased from 19.1 to 29.5 per 100 births. There was a significant average annual increase in primary 4.3% (95%CI 3.0-5.7%) and repeat 4.8% (95% CI 3.9-5.7%) CS rates from 1998 to 2008. After adjusting for maternal and pregnancy factors, the increase in CS delivery over time was maintained. When examining CS rates classified according to the 10-group classification, the greatest contributors to the overall CS rate and the largest annual increases occurred among nulliparae at term having elective CS and multipara having elective repeat CS.
Conclusions: Given that the increased CS rate cannot be explained by known and collected maternal or pregnancy characteristics, the increase may be related to differences in clinical decision making or maternal request. Future efforts to reduce the overall CS rate should be focussed on reducing the primary CS rate.
Figures
References
-
- Laws PJ, Sullivan EA. Australia's mothers and babies 2007. 2009. Sydney. - PubMed
-
- Organisation for Economic Cooperation and Development. Health at a Glance 2007: OECD Indicators. Paris; 2007.
Publication types
MeSH terms
LinkOut - more resources
Full Text Sources
Medical
